
Alternatives got correlated. Then bonds did too.
The 60/40 portfolio had a remarkable run. For decades, government bonds did exactly what allocators needed them to do: rise when equities fell and cushion portfolio drawdowns. The negative correlation between stocks and bonds was so reliable it became the baseline assumption for almost every model portfolio in existence.
Then 2022 happened. From January to October, global equities fell 17.1% and global bonds fell 11.0%, both at the same time, for the same reason: inflation and rising rates.1 The cushion became a second source of loss.
It was the worst joint performance of stocks and bonds in a generation, and it exposed something that had been building quietly for years: the conditions that made 60/40 work were never guaranteed to last.
The deeper problem is that many of the assets sold as the fix only solve part of it. Private equity carries meaningful embedded equity beta once reported valuations are adjusted for smoothing, and real estate remains just as exposed to interest rates. Most liquid alternative strategies fare no better, turning out to be more closely tied to the market they’re meant to diversify than their marketing suggests.
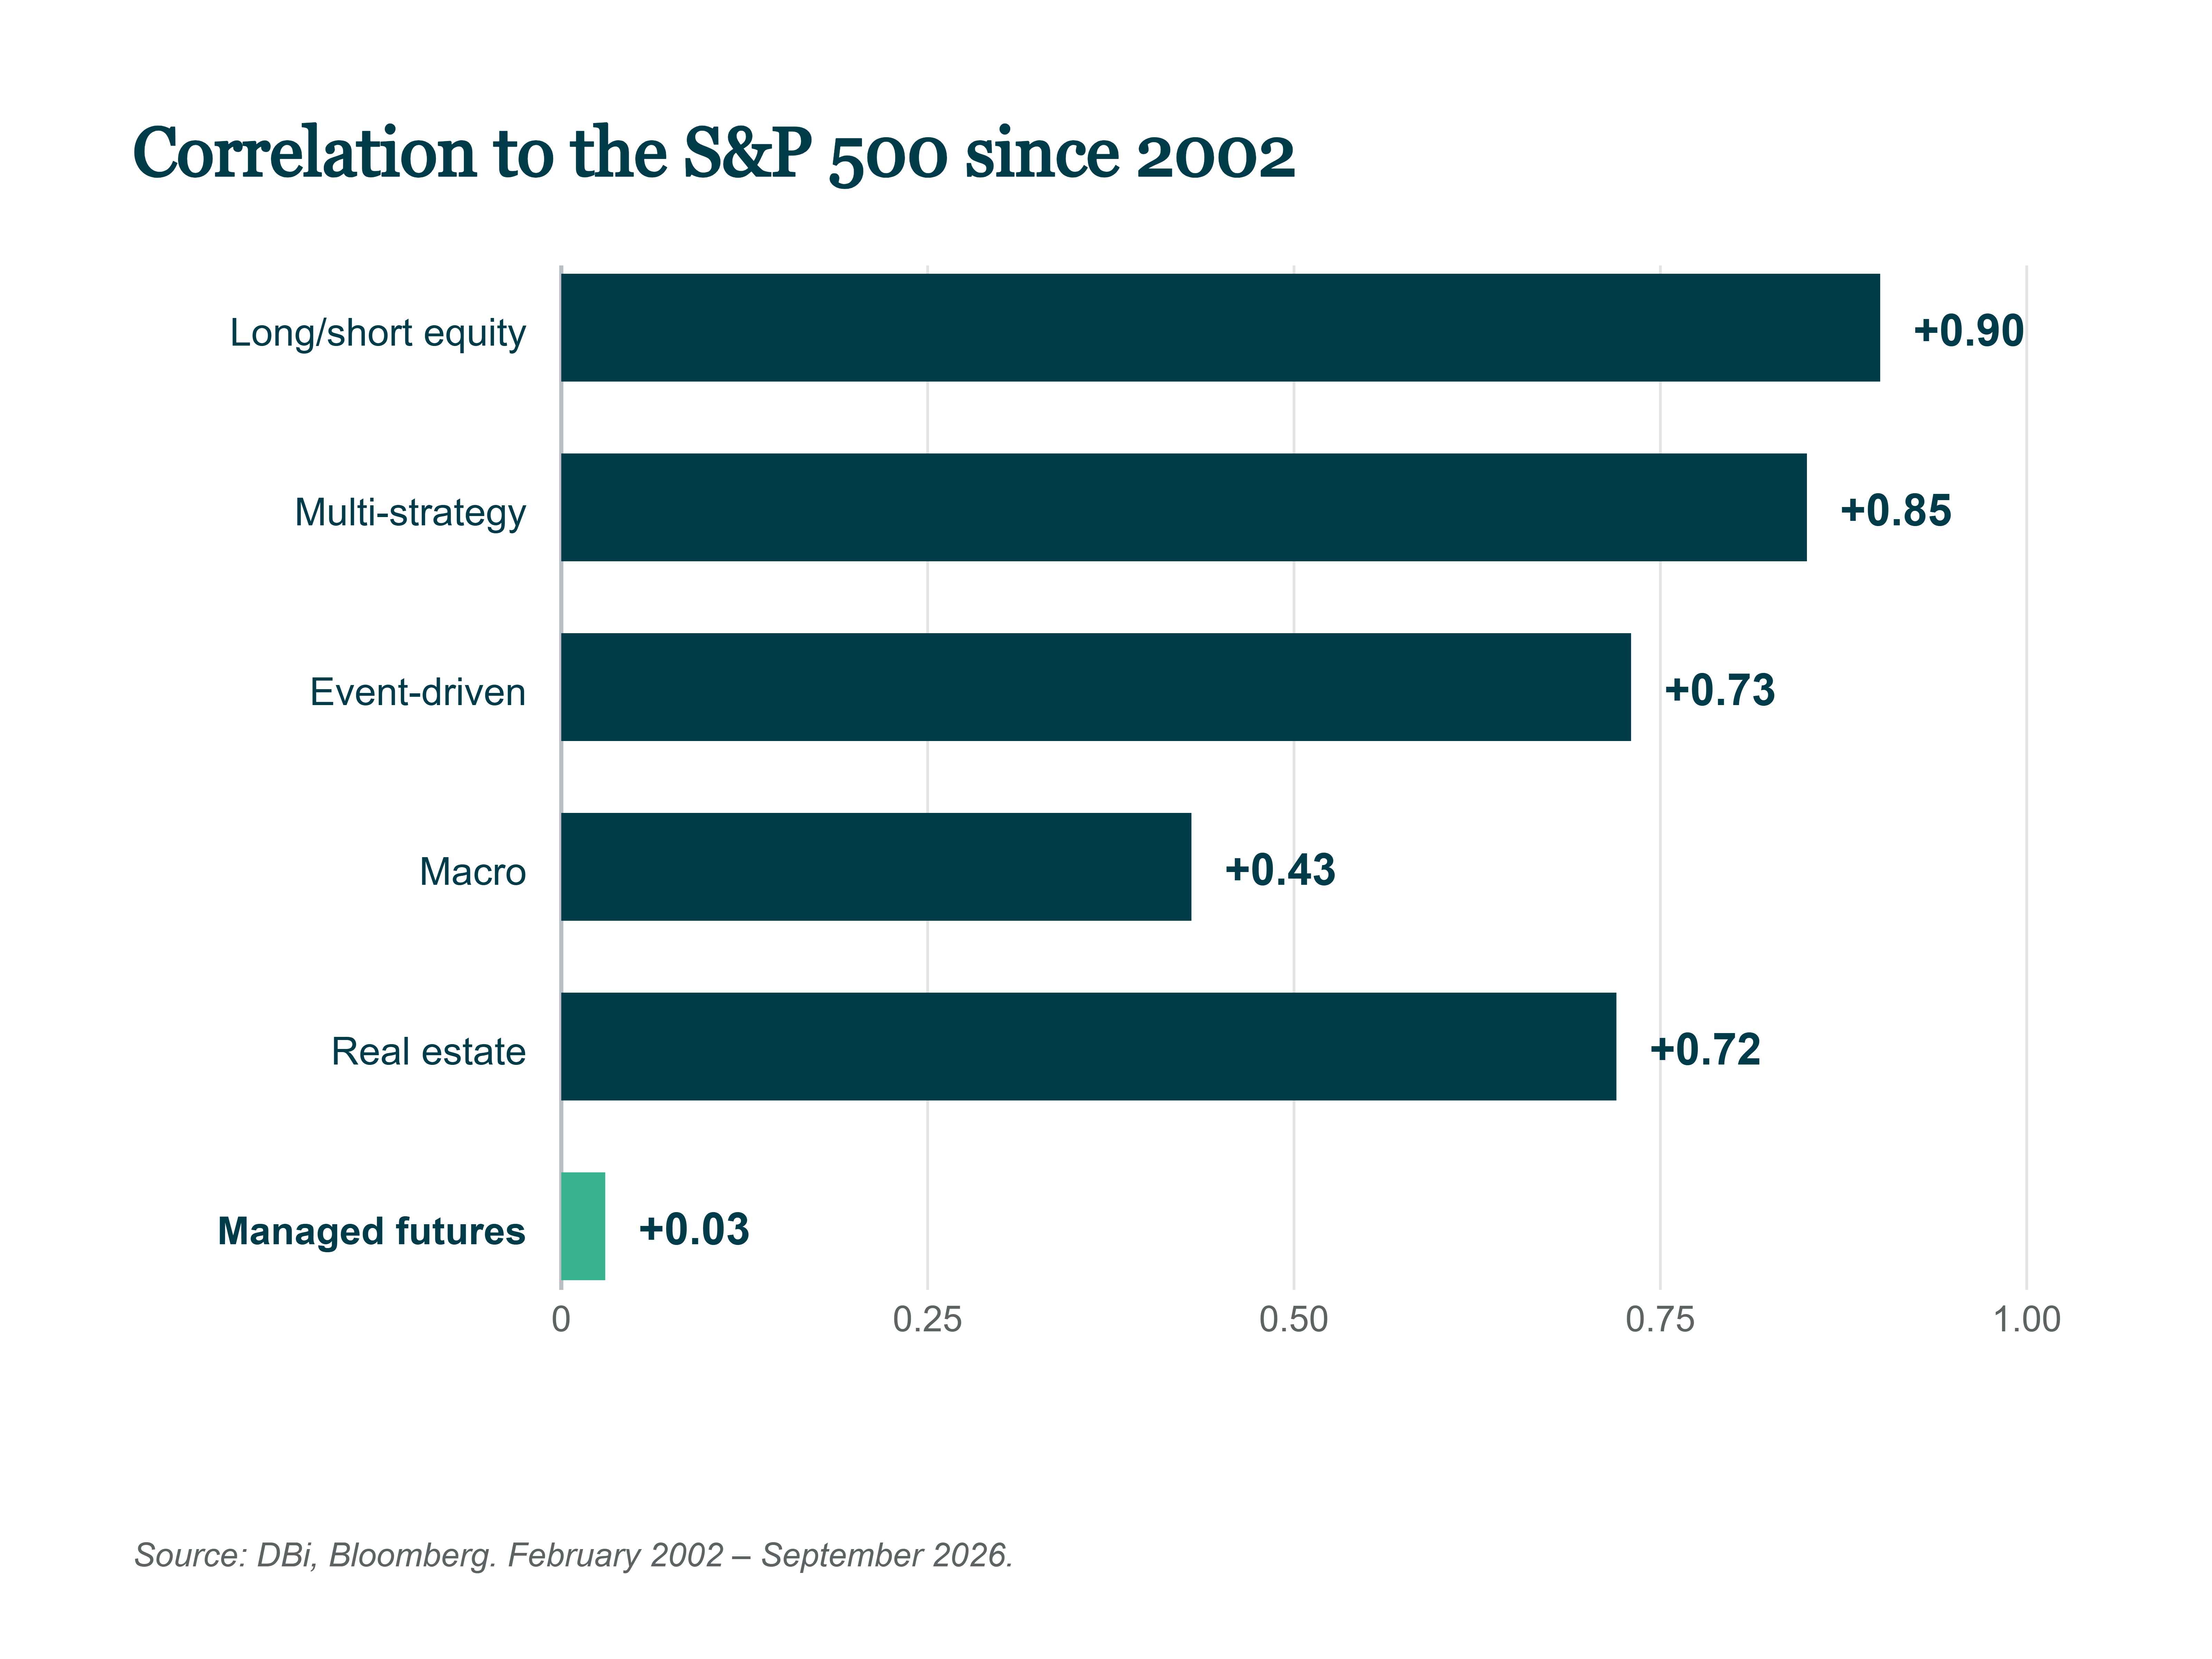
When a real stress event hits, correlations between supposedly uncorrelated assets tend to rise exactly when investors need them not to. Managed futures is one of a small number of exceptions.
Managed futures is a strategy that seeks to predict market trends, going long in rising markets and short in falling ones, across equities, rates, currencies, and commodities.

The crisis data, and what it means
The hedge fund replication methodology of DBi is tracked on a live basis through the SG CTA Managed Futures Index (Bloomberg: SGMDDBMF). It is considered the most reliable available proxy for how this replication-based approach behaves over time, although its limitations should be stated plainly: it is an index rather than a fund, cannot be invested in directly, and no individual investor will have realized precisely its return.
Since 2002, the index has held up across the full cycle on both a return and a risk-adjusted basis relative to the hedge fund index it replicates; its alpha to the S&P 500 has run at more than double the hedge funds’ own.2
This is not a cherry-picked period. It encompasses the dot-com decline, the 2008 financial crisis, the extended range-bound conditions between 2015 and 2020, and 2022. The index is represented in the data throughout, including the periods in which it underperformed.
This is the property that matters most. Not average returns in normal conditions, but the ability to make money when everything else is going down.
Three times this century, equity markets have experienced major, prolonged drawdowns. All three times, the replication index delivered strongly positive returns and outperformed the hedge fund index it replicates.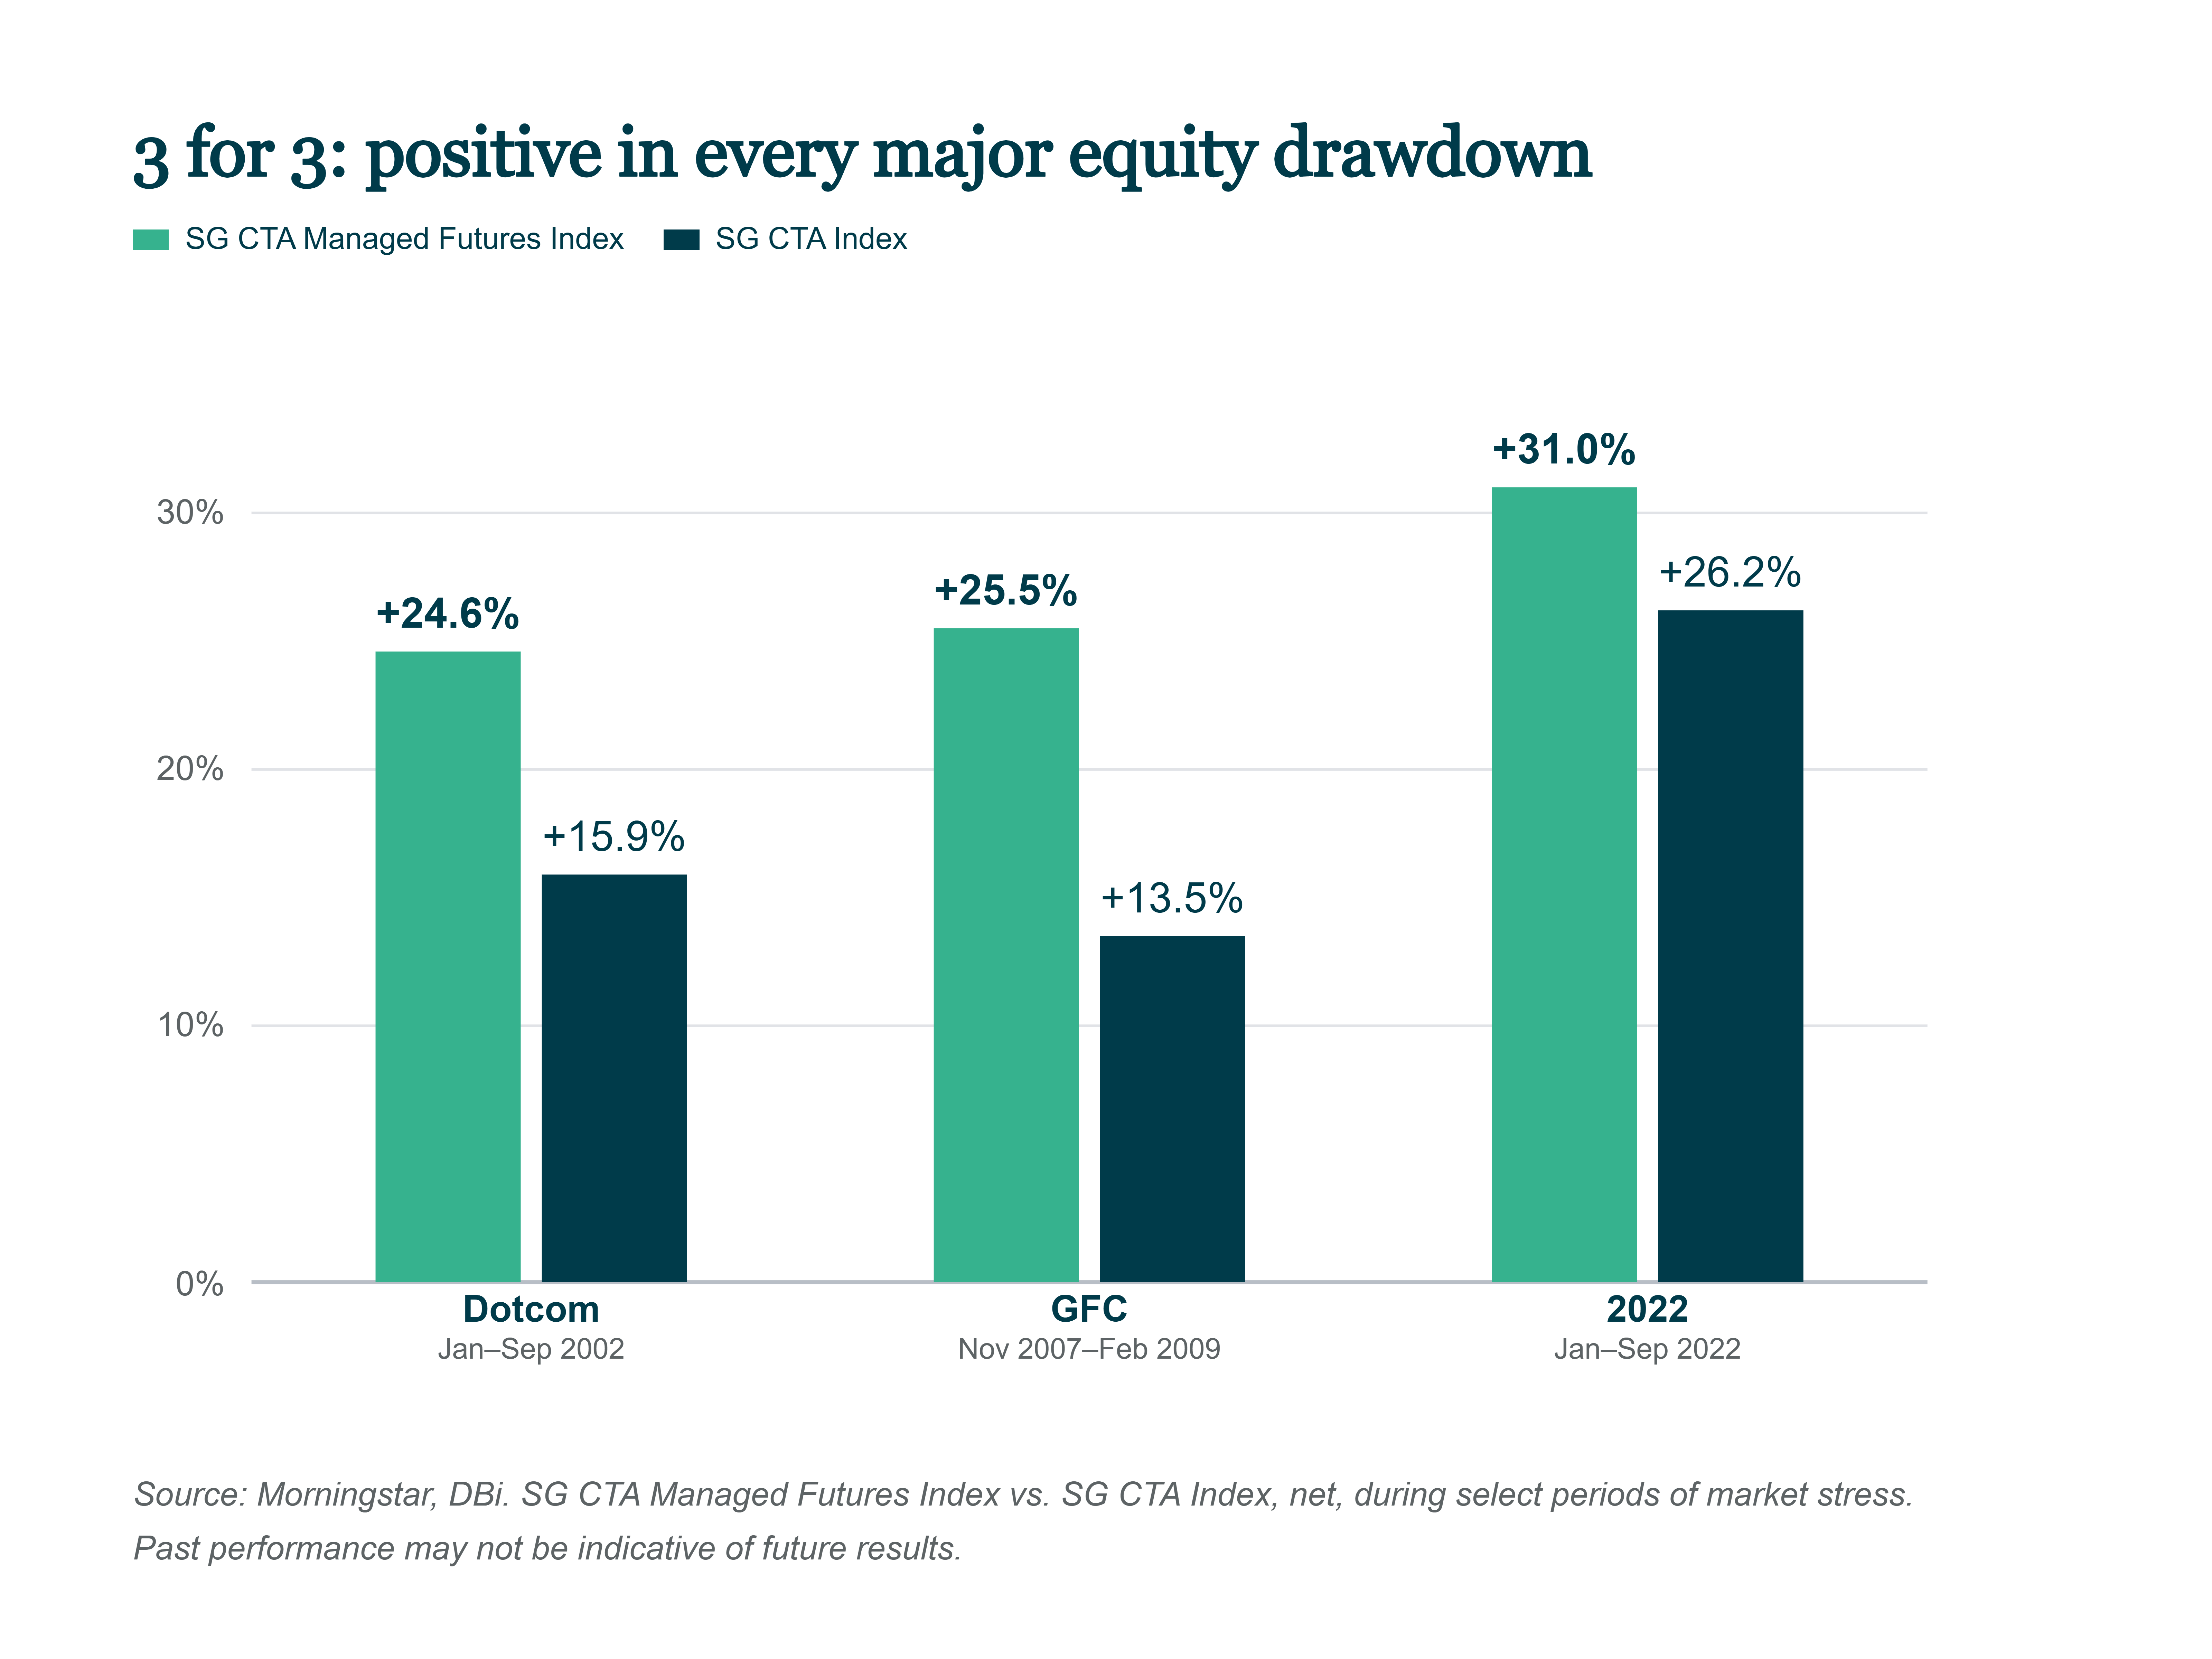
Even through the range-bound conditions between 2015 and 2020, when high-cost hedge funds and mutual funds famously struggled, the efficient replication index compounded at 3.9% a year: modest, but nearly eight times the hedge fund index’s 0.5%.2 The quiet years are part of the evidence too, not an inconvenient exception to it.
How allocators gain exposure in practice
Manager selection remains a material consideration. Even in a year as favorable as 2022 for managed futures overall, individual managers did not capture the opportunity uniformly. The asset class as a whole rose approximately 20% that year, yet around a fifth of mutual funds and ETFs in the sector lost money, illustrating the dispersion risk inherent in selecting a single manager.3
The industry has long argued that complexity is what generates return in this category: more markets, more models, more esoteric instruments, all used to justify higher fees. The available evidence points in the opposite direction: simpler, more liquid implementations have generally retained a greater proportion of the underlying return, rather than losing it to trading costs and slippage. That’s a large part of why replication isn’t a compromise version of the real thing.
The evidence is one thing. Sizing it is another.
For most allocators, the practical question is: what would an allocation have actually meant for a real portfolio in the year that tested the 60/40 assumption most severely?
For 2022, the difference between a 5% allocation and a 20% allocation is the difference between a defensive gesture and something that can meaningfully impact a portfolio’s returns.
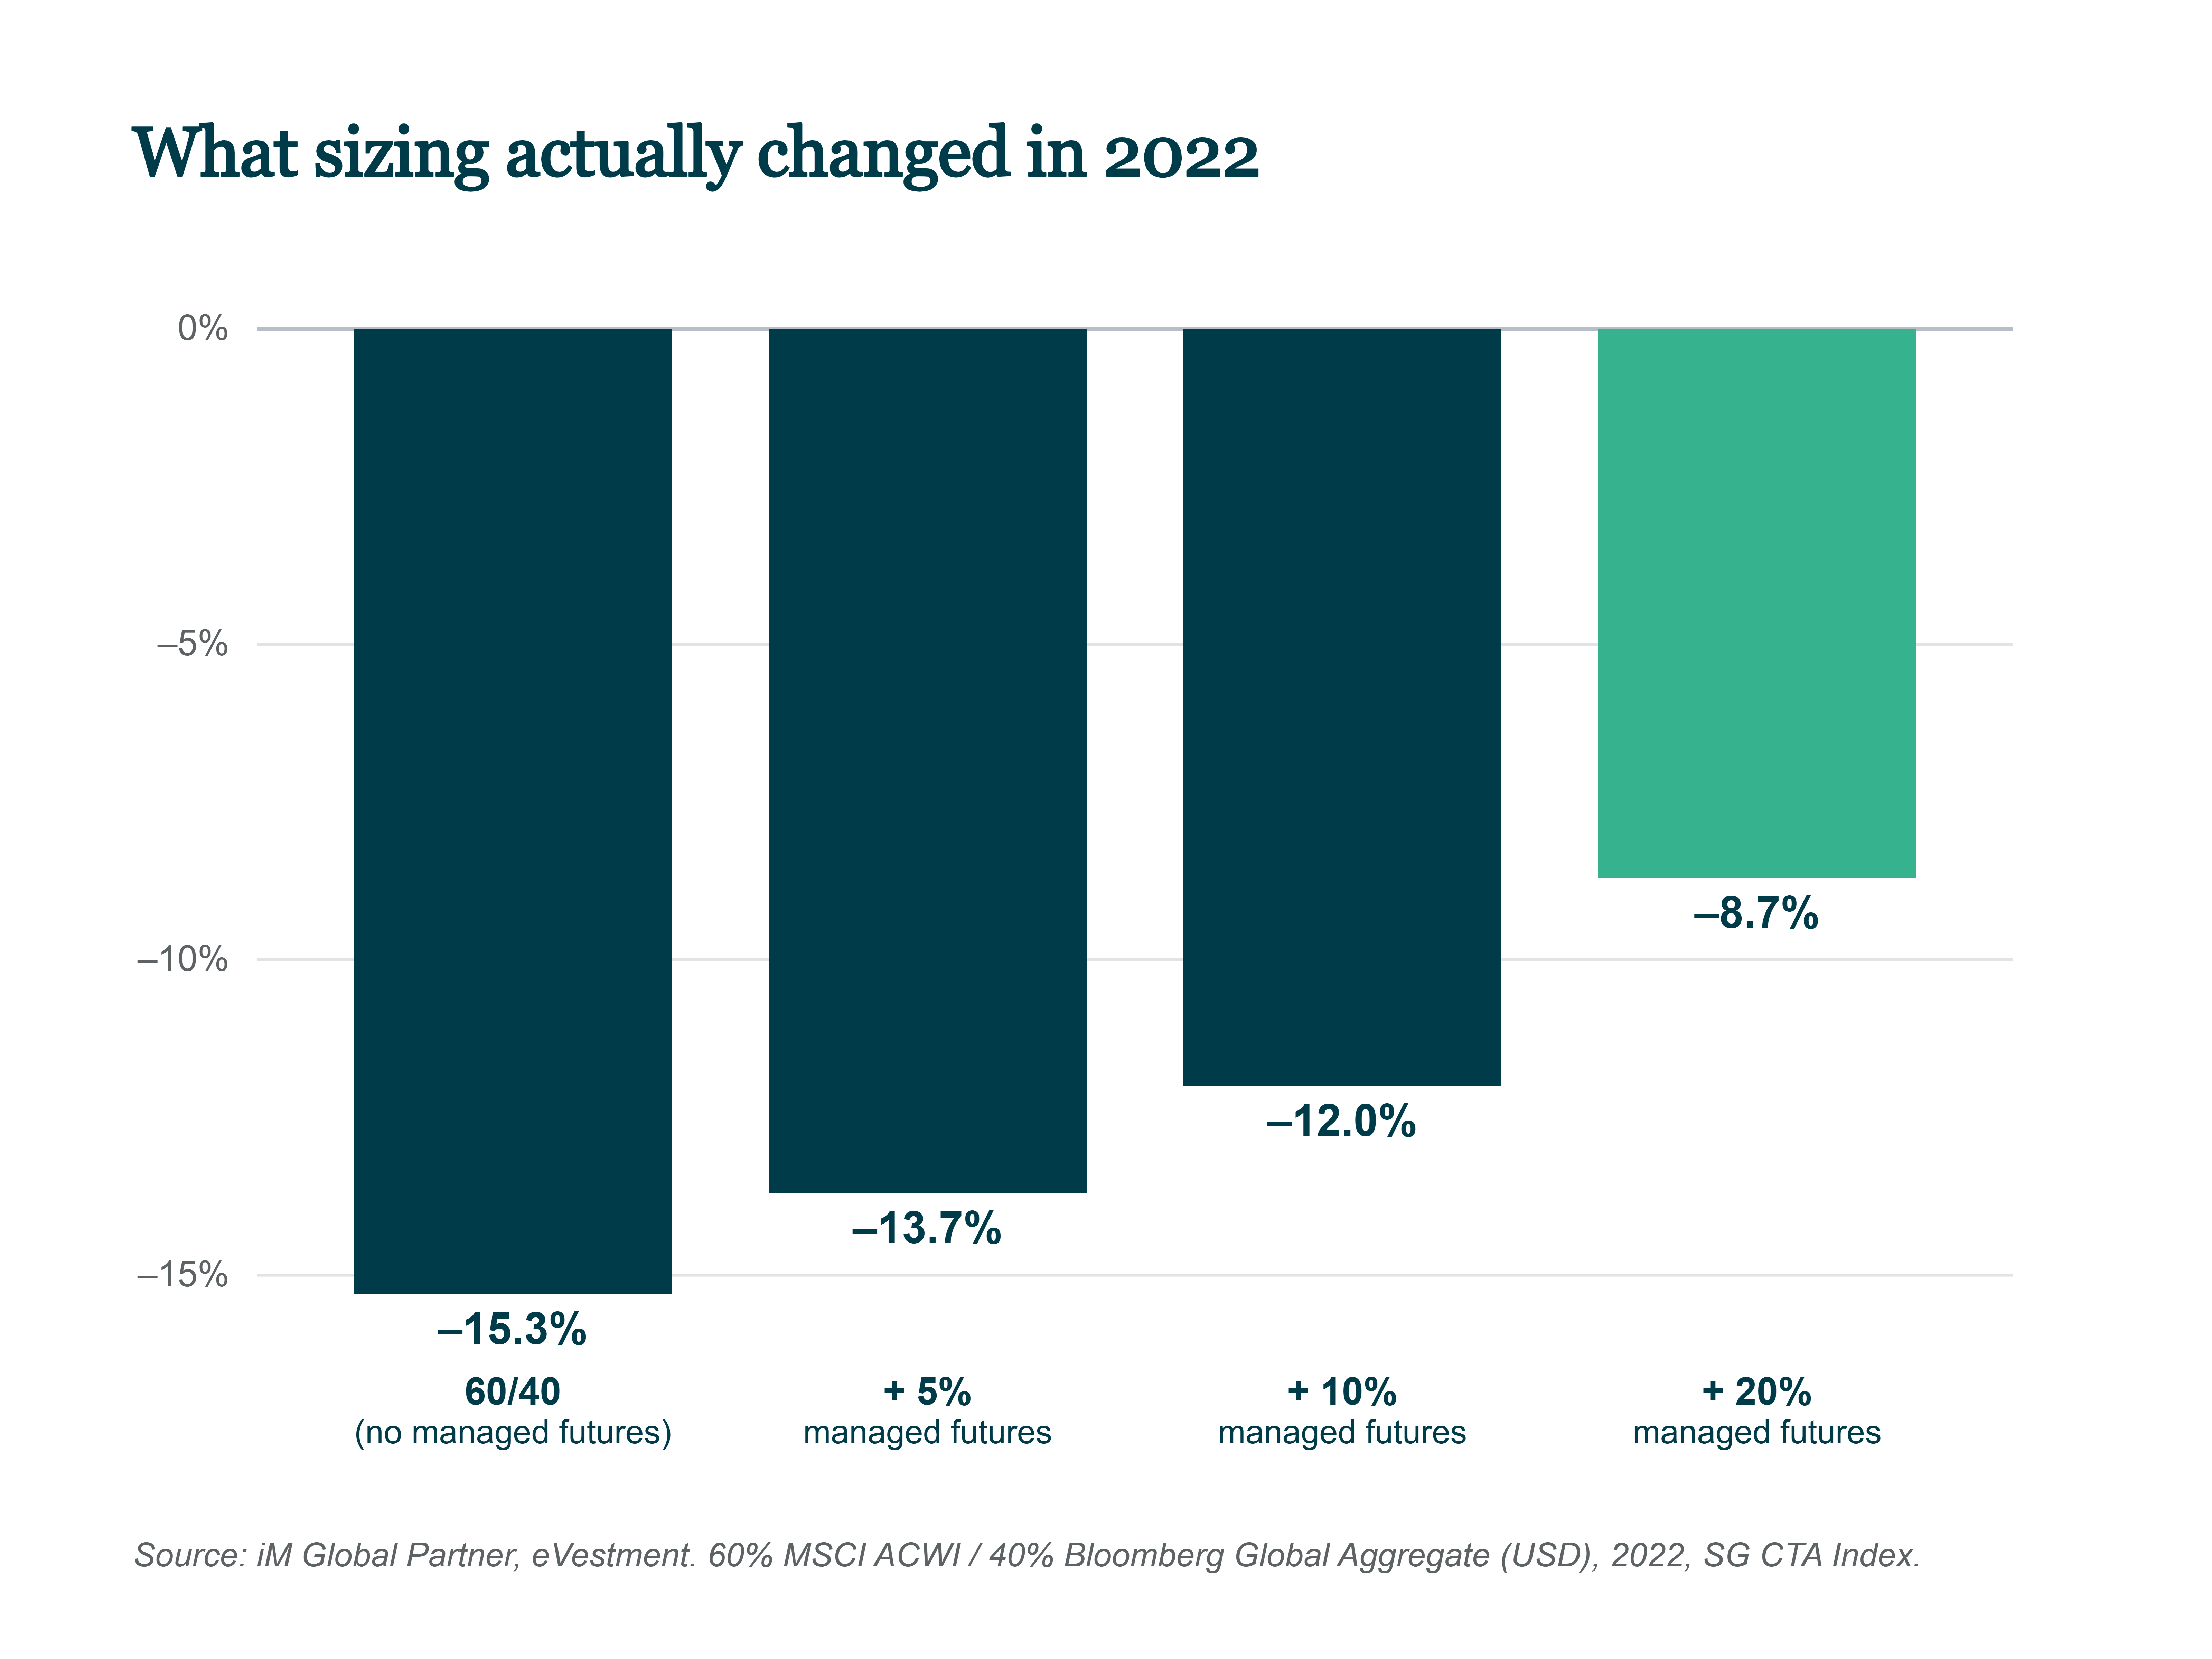
Before sizing, there’s a simpler question: where does the allocation come from? Most allocators fund it from the alternatives sleeve or from fixed income. Funding from fixed income tends to preserve more of the diversification benefit, since it isn’t competing with equity risk already in the portfolio.
What most materials don’t tell you
Before allocating, three questions are worth putting to any managed futures strategy.
Can you hold it through years with no trends to follow?
Managed futures profits from sustained directional moves. In range-bound, choppy markets — 2015–2020 being the clearest example — there is nothing to follow, and the cost isn’t always just a flat quarter. False starts can reverse before a position pays off. Fortunately, strong trends eventually emerge and the patient allocator is rewarded, as 2022 demonstrated.
What is the all-in cost?
In choppy markets, managed futures might deliver 3–5% over cash before costs, but nothing after them. It is worth asking, of any product in this space, what the all-in cost is — management fee and trading costs — and whether the net return justifies the position.
Does its volatility add to portfolio risk, or diversify it?
Managed futures volatility looks high relative to bonds, until you account for correlation.4 Because it moves independently of both equities and bonds, it doesn’t compound the portfolio’s existing risk the way increasing equity exposure would.5 It is a different kind of volatility, not a larger amount of the same kind.
An alternative only earns the name if it does two things: make money when the rest of the portfolio doesn’t, and stay uncorrelated precisely when that’s tested. Most of what’s sold as diversification manages neither. Managed futures is one of the few strategies that’s done both.
The alternative that earns the name. Explore more at dbmf.com
About iMGP & DBi
iM Global Partner and DBi make institutional-quality diversification accessible to all. DBi builds alternative strategies that give portfolios a genuine source of diversification; iMGP brings them to investors worldwide. Together since 2018, their partnership is best represented by DBMF: the world’s largest managed futures ETF, with $5.24 billion in AUM as of 9/30/26.
1 iM Global Partner, eVestment. Returns of the SG CTA Index, MSCI ACWI Index and Bloomberg Global Aggregate Index, January – October 2022, USD terms.
2 DBi, Bloomberg. SG CTA Managed Futures Index (Bloomberg: SGMDDBMF) vs. the SG CTA Index it replicates. February 2002 to September 2026, USD terms. Annualized return over cash, and compounded annual returns for the range-bound period January 2015 to December 2020: Morningstar, DBi.
3 Bloomberg, 31 December 2022. Performance of constituents of the Morningstar US Systematic Trend Index.
4 Morningstar, eVestment, DBi. Maximum drawdown and annualized standard deviation, SG CTA Managed Futures Index and major asset class indices. February 2002 to September 2026.
5 DBi, Bloomberg. SG CTA Managed Futures Index (Bloomberg: SGMDDBMF) correlation to the S&P 500 Total Return Index and the Bloomberg US Aggregate Index. February 2002 to September 2026, USD terms.
This document is provided by iM Global Partner Fund Management, LLC (“iMGPFM”) for informational purposes only and no statement is to be construed as a solicitation or offer to buy or sell a security, or the rendering of personalized investment advice. There is no agreement or understanding that iMGPFM will provide individual advice to any investor or advisory client in receipt of this document. Certain information constitutes “forward-looking statements” and due to various risks and uncertainties actual events or results may differ from those projected. Some information contained in this report may be derived from sources that we believe to be reliable; however, we do not guarantee the accuracy or timeliness of such information. Past performance may not be indicative of future results and there can be no assurance the views and opinions expressed herein will come to pass. Investing involves risk, including the potential loss of principal. Any reference to a market index is included for illustrative purposes only, as an index is not a security in which an investment can be made. Indexes are unmanaged vehicles that do not account for the deduction of fees and expenses generally associated with investable products. For additional information about iMGPFM, please consult the Firm’s Form ADV disclosure documents, the most recent versions of which are available on the SEC’s Investment Adviser Public Disclosure website (adviserinfo.sec.gov) and may otherwise be made available upon written request.
Index and category data shown are not representative of the entire population of CTAs, hedge funds or alternative strategies, may not be indicative of the performance of any individual CTA, hedge fund or investable product, and cannot be traded directly by investors. Indices may not have been adjusted for fees or commissions. The actual rates of return experienced by investors may be significantly different from, and more volatile than, those of the indices shown.