

Bob Iaccino, for CME Group
At a Glance:
- The recurring pattern of flat or declining gold during inflationary periods has historically signaled that markets are already pricing in a tightening shift in Fed policy.
- The CME FedWatch Tool, paired with historical divergence patterns, offers a forward-looking framework for anticipating shifts in gold's performance.
Gold has long been considered a reliable inflation hedge. When consumer prices rise and the metal does not follow, that divergence may be telling investors something the headline numbers cannot: the market is already pricing in Federal Reserve rate hikes.
Thirty years of data suggest this could be the case. Gold does not respond mechanically to inflation. It responds primarily to real yields, which are shaped in large part by the Fed's policy stance. When inflation rises but the Fed stays accommodative, real yields remain low or negative, supporting gold. Once the Federal Open Market Committee (FOMC) shifts toward tightening, real yields climb and gold loses its appeal, even when inflation data remain elevated.
The Mechanism Behind the Metal
Gold pays no interest, which means its opportunity cost rises when real rates increase. Investors holding gold forgo the yield available elsewhere, and as that yield grows more attractive, gold becomes comparatively less so.
This dynamic becomes particularly useful as a forward-looking signal, since markets often price in the expected policy path well before the first rate hike arrives. When the FOMC signals a shift from accommodation toward tightening — through meeting minutes, dot plot revisions or Fed Chair commentary — gold often starts to weaken in anticipation rather than in response. The actual rate decision, when it comes, may already be fully reflected in the price.

This is why flat or declining gold during a period of rising inflation may be more reflective of a hedge against the policy shift rather than the inflation itself.
A Recent Case Study: 2021-2022
The pattern was on display between May 2021 and February 2022 when core personal consumption expenditures (PCE) moved above 2.5% and continued higher, while the FOMC stayed accommodative. Gold did not deliver the rally that rising inflation alone might have suggested. It traded mostly sideways — a performance that puzzled many investors who were positioned for a classic inflation trade.
The stronger returns showed up in the forward data. Gold's 3- and 12-month forward returns outpaced returns from most other periods in the sample, suggesting the flat price action during peak accommodation was not an anomaly but a setup.
When the Fed began raising rates in March 2022, gold fell even as inflation held well above target for months afterward. The metal had already started discounting the rise in real yields to come. By the time the first hike landed, much of the repricing had already occurred.
This sequence – sideways gold, rising inflation, eventual Fed tightening, then a gold decline – has repeated across the broader three-decade window. Periods of rising core PCE during accommodative Fed policy have generally produced stronger subsequent gold returns than periods when the FOMC was already in an active hiking cycle.
Reading the Divergence
For market participants, the takeaway is that when inflation prints are strong but gold refuses to participate, the divergence is often saying more about the Fed's likely next move than about any breakdown in gold's hedging properties.
Other factors can move gold — geopolitical risk, dollar strength, central bank buying — and those forces can, at times, override the real yield signal. However, when those variables are not obviously dominant, flat or declining gold during an inflationary period has proven to be a consistent leading indicator that the Fed is preparing to act.
Using FedWatch as a Real-Time Guide
One practical way to monitor this shift is the CME FedWatch Tool, specifically its Probabilities tab. The tool aggregates futures market pricing to display implied probabilities for different Fed rate decisions at upcoming meetings, updated in real time as market sentiment evolves.
When the probability of a hike begins to rise meaningfully, even before any action is taken, it can serve as an early warning that the accommodative environment supporting gold is starting to close. For example, if core PCE is still rising but the CME FedWatch Tool shows the odds of a hike at the next FOMC meeting climbing from 20% to over 60%, it suggests the market is already shifting its view of the FOMC’s stance. In such cases, gold has historically begun to struggle even before the actual policy change takes place. This gives market participants a forward-looking framework rather than relying solely on lagging inflation prints.
CME FedWatch also allows users to track shifts across multiple meeting horizons, which can help distinguish between a market pricing a single near-term hike and one positioning for a sustained tightening cycle. The latter has historically carried greater implications for gold over 6- to 12-month windows.
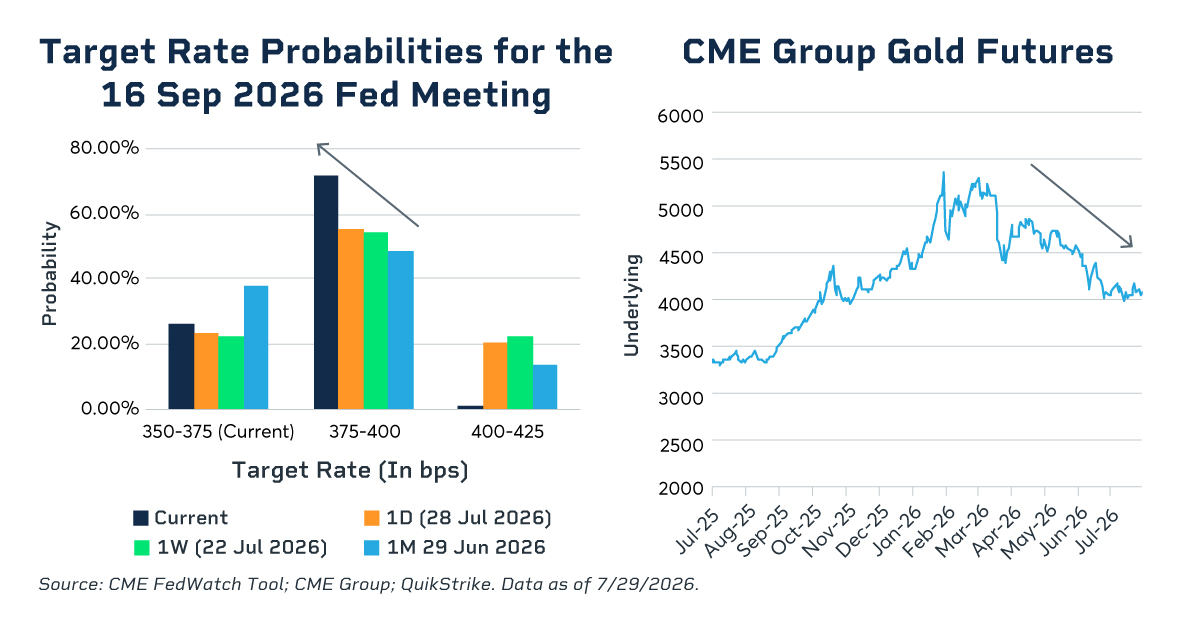
Flat or declining gold during periods of rising inflation has historically been consistent with markets anticipating a tighter policy path, not a broken hedge or a structural shift in gold's role. Combining historical patterns with real-time tools like the CME FedWatch Tool provides a more complete picture for anticipating when gold’s performance may begin to weaken.
CME Group futures are not suitable for all investors and involve the risk of loss. Full disclaimer. Copyright © 2026 CME Group Inc.