

Jim Jordan, Tom Allen, and Maurice FitzMaurice for Fidelity Investments
Key takeaways
- Mid caps represent companies transitioning from validated business models to scaled, self-funded expansion, offering a compelling combination of growth, stability, profit, and valuation.
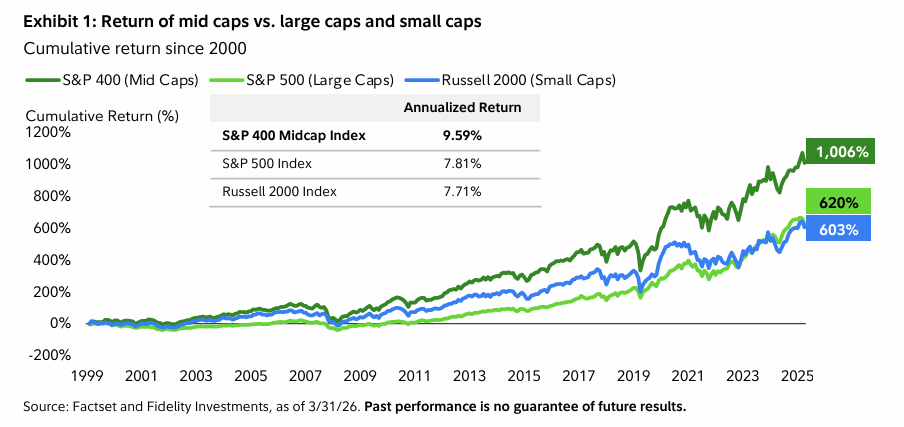
- The S&P MidCap 400 index has meaningfully topped the cumulative performance of benchmark large and small cap indexes since 2000, while trading at a lower aggregate price-to-earnings multiple than the S&P 500 index over this period.
- As an asset class, mid caps can add structural breadth and economic diversification within equity portfolios, while exhibiting less concentration risk and vulnerability to crowding than large caps.
- From a quantitative standpoint, greater return dispersion, higher levels of stock specific risk, and lower correlations among constituents suggest mid caps may offer more opportunities for active stock picking.
- A select group of mid caps may be uniquely positioned to benefit from temporary price dislocations associated with index reconstitutions.
Why invest in mid cap stocks now
If you’re concerned about increasing exposure to a limited number of equity investment themes and elevated concentration and crowding risks, mid caps may be an important part of the solution.
They offer investors a way to access a diverse set of companies as they transition from proven business models to scaled, self-funded expansion.
This stage of a company’s life cycle can offer a balance of growth, stability, quality, valuation, and cyclical exposure.

What makes mid caps different
Unlike small caps, most mid cap companies are no longer in an early growth stage and have demonstrated demand for their products or services over time. Most benchmark S&P MidCap 400 Index components have achieved consistent profitability and relatively stable balance-sheet characteristics, supported by quality based index inclusion rules.
Unlike large caps, fewer mid caps have reached structural maturity, such as market saturation or the need for large-scale restructuring. Many still have room to expand revenue, allowing operating leverage to contribute to earnings growth. As a result, they may be less dependent on efficiency gains or sustained pricing power to support earnings.
This life-cycle positioning helps explain the long-term return profile of mid caps. Exhibit 1 shows the cumulative returns of mid cap stocks versus large caps and small caps since 2000.
Although mid caps are exposed to cyclical economic dynamics, resilience during economic slowdowns can, in some cases, be aided by company-specific characteristics. Mid cap companies with long-term competitive advantages, pricing power, or exposure to secular growth trends may be less sensitive to near-term economic fluctuations and demonstrate more stable earnings trajectories relative to broader indexes. This is not uniform across the segment, however, as large caps, in general, tend to have larger balance sheets and greater geographic diversification, which supports their earnings stability.
The growth profile of mid caps
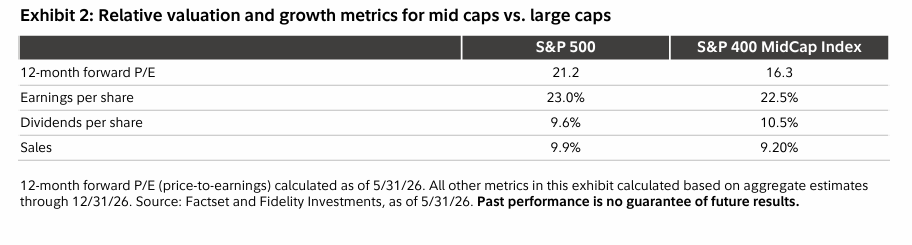
Exhibit 2 highlights an additional characteristic of mid caps: Aggregate growth expectations are broadly comparable to those of large cap stocks, despite mid caps trading at a lower multiple of forward earnings as of May 2026.
This may allow room for stock-multiple expansion over time.
When to invest in mid caps
Is there a right time to invest in mid caps as part of a diversified portfolio? Any time might be the answer, as they offer a differentiated set of companies with heavy exposure to the U.S. economic cycle (and less exposure to global economics). For example, industrials accounted for roughly 26% of the S&P MidCap 400 versus only about 9% of the S&P 500 as of May 2026. This could, in theory, better position the S&P MidCap 400 in a cyclical economic recovery that could include some mix of U.S. Federal Reserve rate cuts, geopolitical conflict resolution, a drop in oil prices, and fiscal stimulus.
Otherwise, buying at low valuations versus large caps appears to have offered an advantage, based on the performance history following recent relative valuation peaks and troughs.
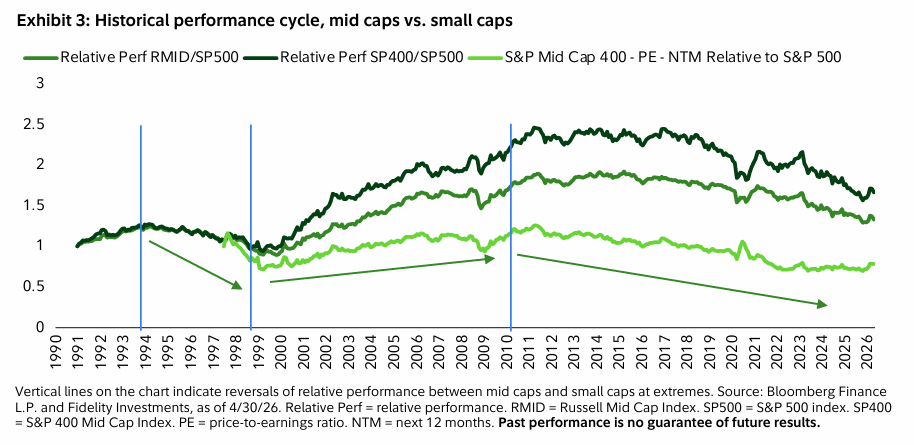
Exhibit 3 shows that from 1990 to 1994, and from 1999 to 2011, mid caps outperformed large caps, typically following periods of relatively low valuations (troughs). Conversely, from 1994 to 1999, and from 2011 to 2026, large caps led mid caps, coinciding with elevated mid cap relative valuations (peaks). The amplitude of these cycles varied, but the pattern remained consistent: Extreme relative valuations tended to precede reversals in performance leadership.
As of May 2026, the mid cap to large cap relative valuation stood at 0.78, suggesting mid caps may be closer to a trough than a peak.
Security selection among mid caps
Mid caps may offer a broader set of security selection opportunities relative to large caps based on several structural differences.
- The top 10 components of the S&P 400 MidCap Index comprise only about 5% of the index, compared with 32% for the top 10 S&P 500 Index components. Therefore, mid caps exhibit less dependence on a small number of dominant stocks—many of which are tied to similar themes in large cap indexes.
- The sector balance of the S&P 400 MidCap is more evenly distributed than that of the S&P 500. There is less exposure to mega-cap technology and communication services, and relatively more exposure to cyclical sectors.
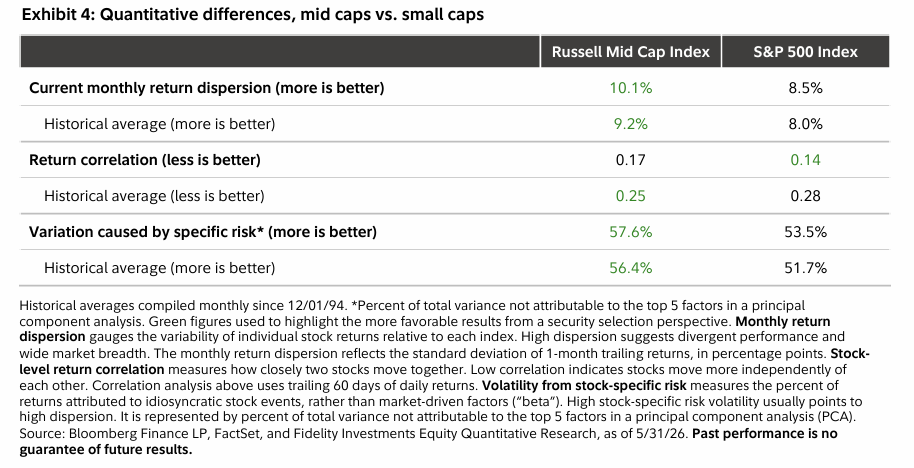
- Mid caps have shown greater return dispersion, more variation caused by company-specific risk factors, and somewhat lower return correlations versus large caps over time (Exhibit 4). This means a larger share of returns may be driven by individual company outcomes, as opposed to broad market movements, which can support active security selection. For this exercise, we studied the Russell Mid Cap Index as a proxy for mid caps, because it includes roughly double the components of the S&P 400 MidCap Index. Using the broader index in this instance can help reduce the chance of a few constituents skewing the quantitative metrics.
Unique selection opportunities for mid caps
Lastly, mid caps present two repeatable sources of stock-level inefficiency, each related to movements in and out of major indexes (fallen angels and rising stars). These transitions can create recurring, non-fundamental dislocations in pricing and investor positioning.
Fallen angels
Fallen angels are companies that were once S&P 500 constituents but were downgraded to the S&P MidCap 400 Index due to declining market values or changing fundamentals. This may occur due to earnings disappointments, sector re-rating, or balance sheet pressure.
These transitions can trigger selling by S&P 500 index investors and create temporary price dislocations.
Managers who can distinguish between companies facing temporary pressures and those facing structural challenges may be able to purchase attractive long-term holdings at discounted prices.
Rising stars
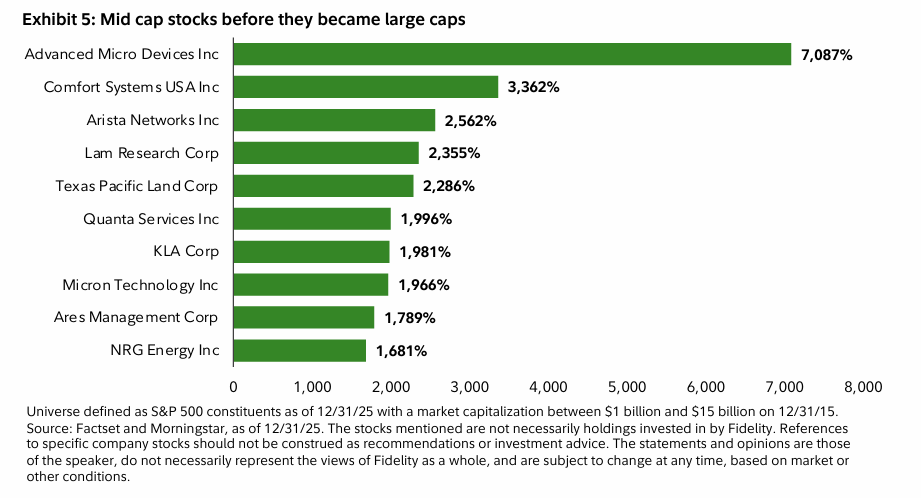
Rising stars are fast-growing mid cap companies that eventually move into the S&P 500 index. Exhibit 6 shows the 10-year cumulative returns through the end of 2025 for a select group of S&P 500 components that began the decade as mid cap stocks and, within this time period, became rising stars.
Many of these companies may exhibit sustained earnings growth, improving operating efficiency, and increasing investor recognition prior to S&P 500 inclusion. When they are added to the S&P 500, additional demand from index investors may affect ownership, liquidity, and valuations.
While valuations for these companies may already reflect some growth expectations, the transition to large cap status can, in some cases, coincide with additional multiple expansion.
Conclusion
The role of mid caps within an equity allocation goes beyond their position between large and small caps.
Mid caps are composed of companies in transition—firms either scaling their operations or adjusting following periods of prior growth. This dynamic contributes to a combination of characteristics that differ from other equity segments.
The structural features of mid caps—balanced growth characteristics, broader exposure, higher dispersion, and ongoing index turnover—have led to returns more dependent on individual company outcomes than on a small number of index-level drivers.
Also, the continuous movement of companies into and out of the segment can introduce periodic inefficiencies driven by index mechanics, investor behavior, and changing ownership.
Taken together, these features suggest mid caps can serve as a differentiated source of investment returns, with meaningful opportunities for active security selection.
Access the full paper at institutional.fidelity.com.
Learn more about Fidelity Institutional Solutions.
Please visit Fidelity’s Communities on Alternative Investments.

Unless otherwise expressly disclosed to you in writing, the information provided in this material is for educational purposes only. Any viewpoints expressed by Fidelity are not intended to be used as a primary basis for your investment decisions and are based on facts and circumstances at the point in time they are made and are not particular to you. Accordingly, nothing in this material constitutes impartial investment advice or advice in a fiduciary capacity, as defined or under the Employee Retirement Income Security Act of 1974 or the Internal Revenue Code of 1986, both as amended. Fidelity and its representatives may have a conflict of interest in the products or services mentioned in this material because they have a financial interest in the products or services and may receive compensation, directly or indirectly, in connection with the management, distribution, and/or servicing of these products or services, including Fidelity funds, certain third-party funds and products, and certain investment services. Before making any investment decisions, you should take into account all of the particular facts and circumstances of your or your client’s individual situation and reach out to an investment professional, if applicable.
References to specific investment themes are for illustrative purposes only and should not be construed as recommendations or investment advice. Investment decisions should be based on an individual’s own goals, time horizon, and tolerance for risk.
This content contains statements that are "forward-looking statements," which are based upon certain assumptions of future events. Actual events are difficult to predict and may differ from those assumed. There can be no assurance that forward-looking statements will materialize, or that actual results will not be materially different from those presented.
Fidelity Investments is an independent company, unaffiliated with Institutional Investor LLC. There is no form of legal partnership, agency affiliation, or similar relationship between your financial advisor and Fidelity Investments, nor is such a relationship created or implied by the information herein. Fidelity Investments is a registered service mark of FMR LLC.
Fidelity Investments® provides investment products through Fidelity Distributors Company LLC; clearing, custody, or other brokerage services through National Financial Services LLC or Fidelity Brokerage Services LLC, Members NYSE, SIPC.
Institutional asset management is provided by FIAM LLC and Fidelity Institutional Asset Management Trust Company.
1266895.2.0