

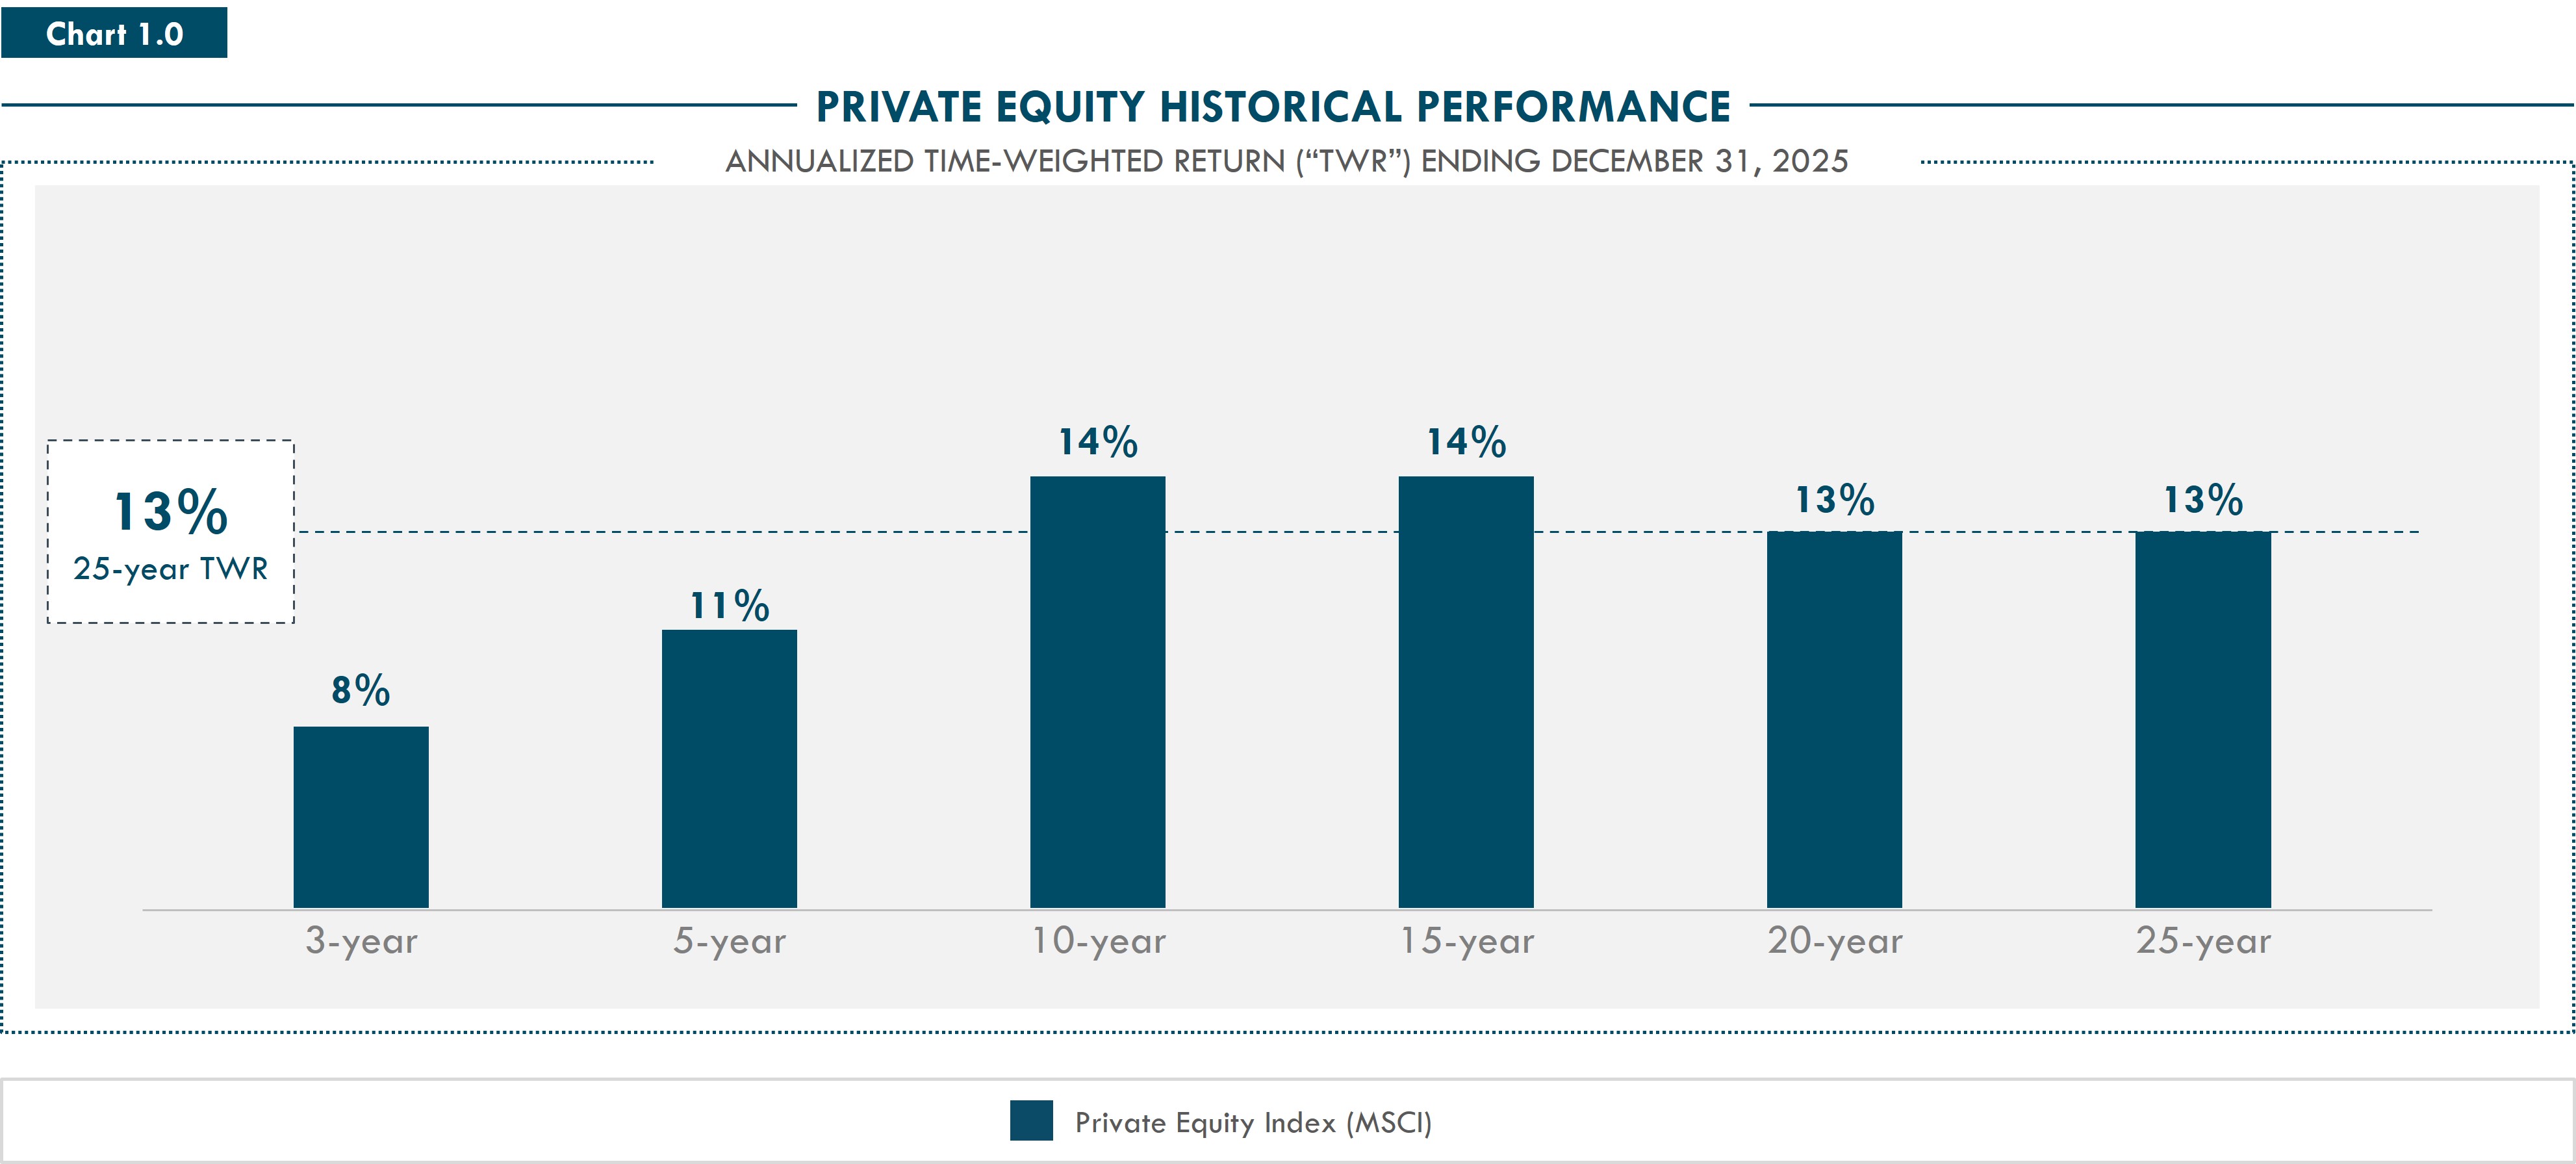
Over the past 25 years, private equity evolved into an important allocation for institutional investors, driven by an ownership model purpose-built for longer-term value creation which, in turn, drove strong returns. In recent years, however, a healthy level of scrutiny has emerged. Private equity returns have moderated relative to the historical average time-weighted net return of approximately 13% over the prior 25 years, and some investors have begun to question what lies ahead (See Chart 1.0).
This paper, the first in Dawson's three-part Spotlight on Private Equity series, examines how the private equity toolkit has evolved over the past quarter century and why we believe the next chapter of the asset class will require a new approach to value creation. But to understand where private equity is going, we first need to understand where it has been. We begin with a look back at the asset class's history and the value creation levers available to it, then turn to what it will take for private equity to return to historical levels of performance.
While we acknowledge the recent performance trends, we do not share the pessimism. When we analyzed private equity's performance over the last 25 years, a more nuanced and ultimately more encouraging picture emerged. The industry is not broken. But it does require evolution for it to sustain historical levels of returns. As markets shifted, we saw an industry that was continuously evolving, and an asset class that is well placed to adapt to the next potential step into a new era of value add. We believe today’s environment requires the next evolution of the private equity toolkit.
The results of our analysis challenge what we view as three common misconceptions: that the industry today is the same as it was 25 years ago; that the value creation toolkit has remained static; and that returns have been driven by a single, linear process. What became clear to us is that What Got Private Equity Here, Won't Get It There. This is not a warning, but an opportunity.
Private equity has historically adapted and evolved. In its early days, it learned how to use leverage. Then how to grow businesses. Today, we believe private equity is entering a new period: the Era of Active Management. In this era, success will be linked to the ability to drive operational efficiencies at scale. We see sponsors as well-positioned for this moment: they hold concentrated ownership, govern with more aligned incentives, and deploy patient capital that better enables transformations in their portfolio companies. These are structural advantages that we believe become more relevant in an era where execution may be the differentiator.
TO UNDERSTAND WHERE WE ARE GOING, WE NEED TO UNDERSTAND WHERE WE HAVE BEEN: THE THREE ERAS OF PRIVATE EQUITY
ERA 1: EFFECTIVE USE OF LEVERAGE (2000-2007)

We view the first era (2000 – 2007) of private equity value creation as being defined by the effective use of leverage. Sponsors were on average acquiring businesses at approximately 10x valuations and financing those transactions with nearly 6x leverage, averaging roughly 57% debt-to-capital at entry, meaning more than half of the purchase price was financed with debt (See Chart 2.0). This enabled the equity value to compound quickly over the hold period, so long as the company performed well. This was the leverage effect which characterized the era.
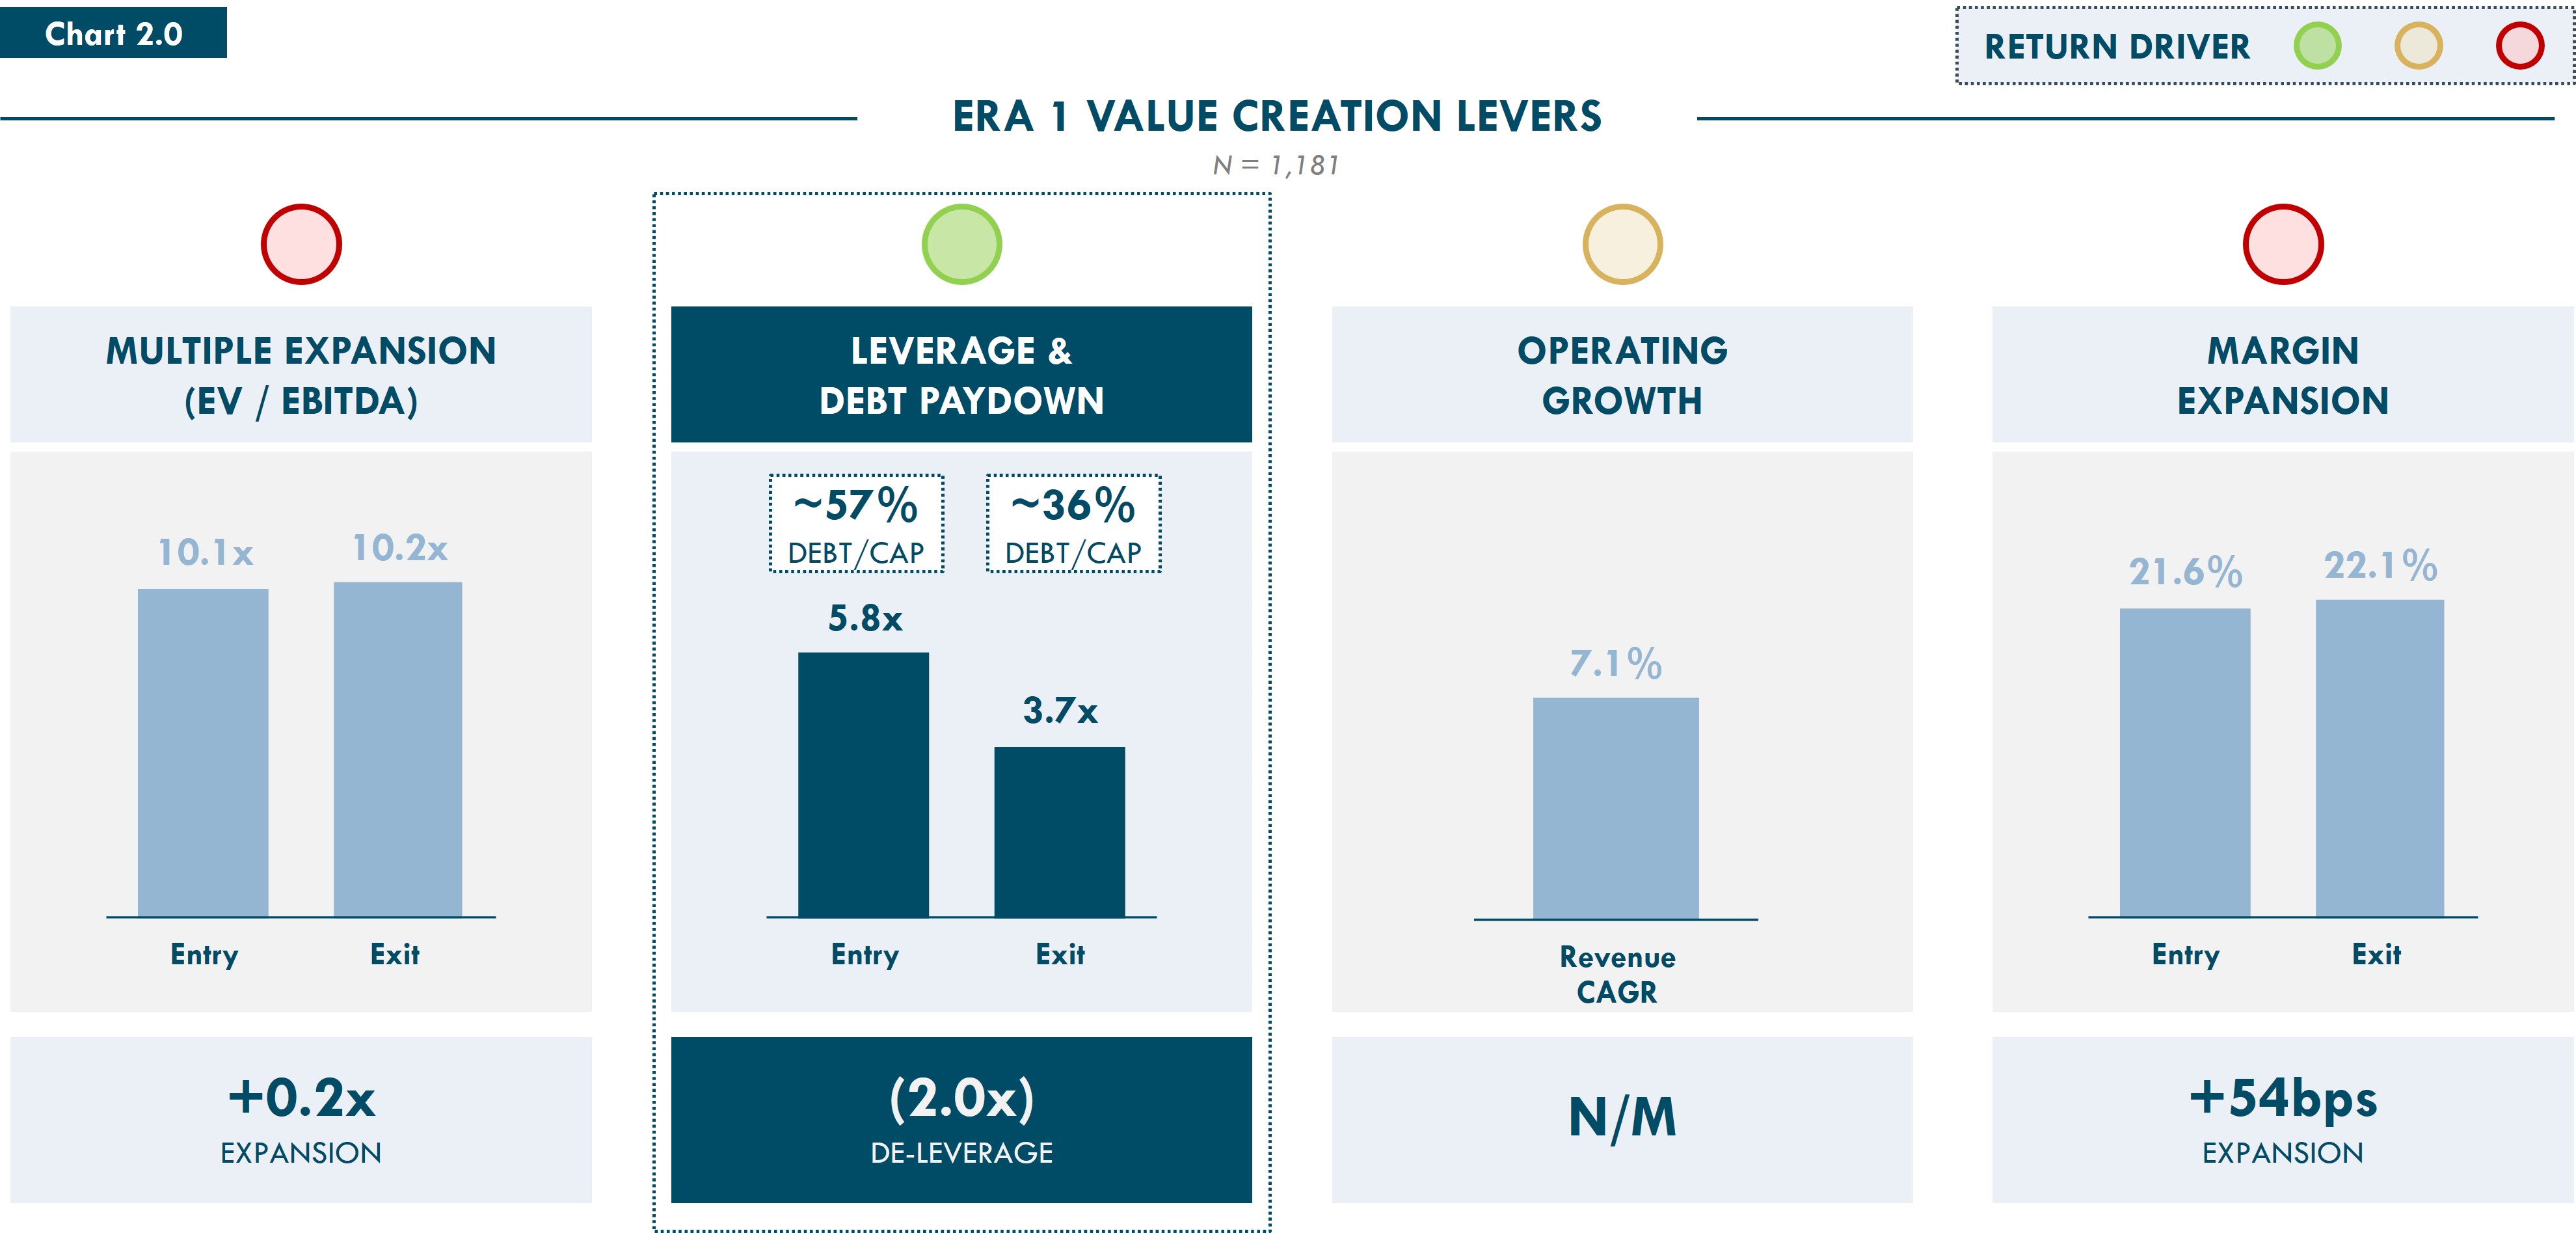
The result was compelling: gross returns of approximately 2.25x MoC. While some have dismissed this era simply as a time of financial engineering, we believe it overlooks foundational skills that help define it. We see sponsors in this era as more disciplined capital allocators who understood how to structure transactions, select stable companies in resilient industries, and create value through systematic deleveraging. These learnings would serve as a foundation of the private equity toolkit beyond this era.
However, as more capital entered the market and debt markets matured, this resulted in leverage alone becoming less differentiated as a return driver. As the industry matured, it required private equity to evolve and adapt its tools to sustain performance, which pushed the industry toward a more sophisticated mix of value creation tools. With this next shift, leverage remained a foundational contributor, but it was no longer the only tool.
ERA 2: GROWTH OVER EFFICIENCY (2008-2021)
Following the Global Financial Crisis, the playbook evolved. Interest rates declined and remained low for over a decade. Cheaper financing accelerated transaction activity, and our analysis shows that sponsors increasingly turned their attention from capital structure toward a new primary value creation driver: growth.
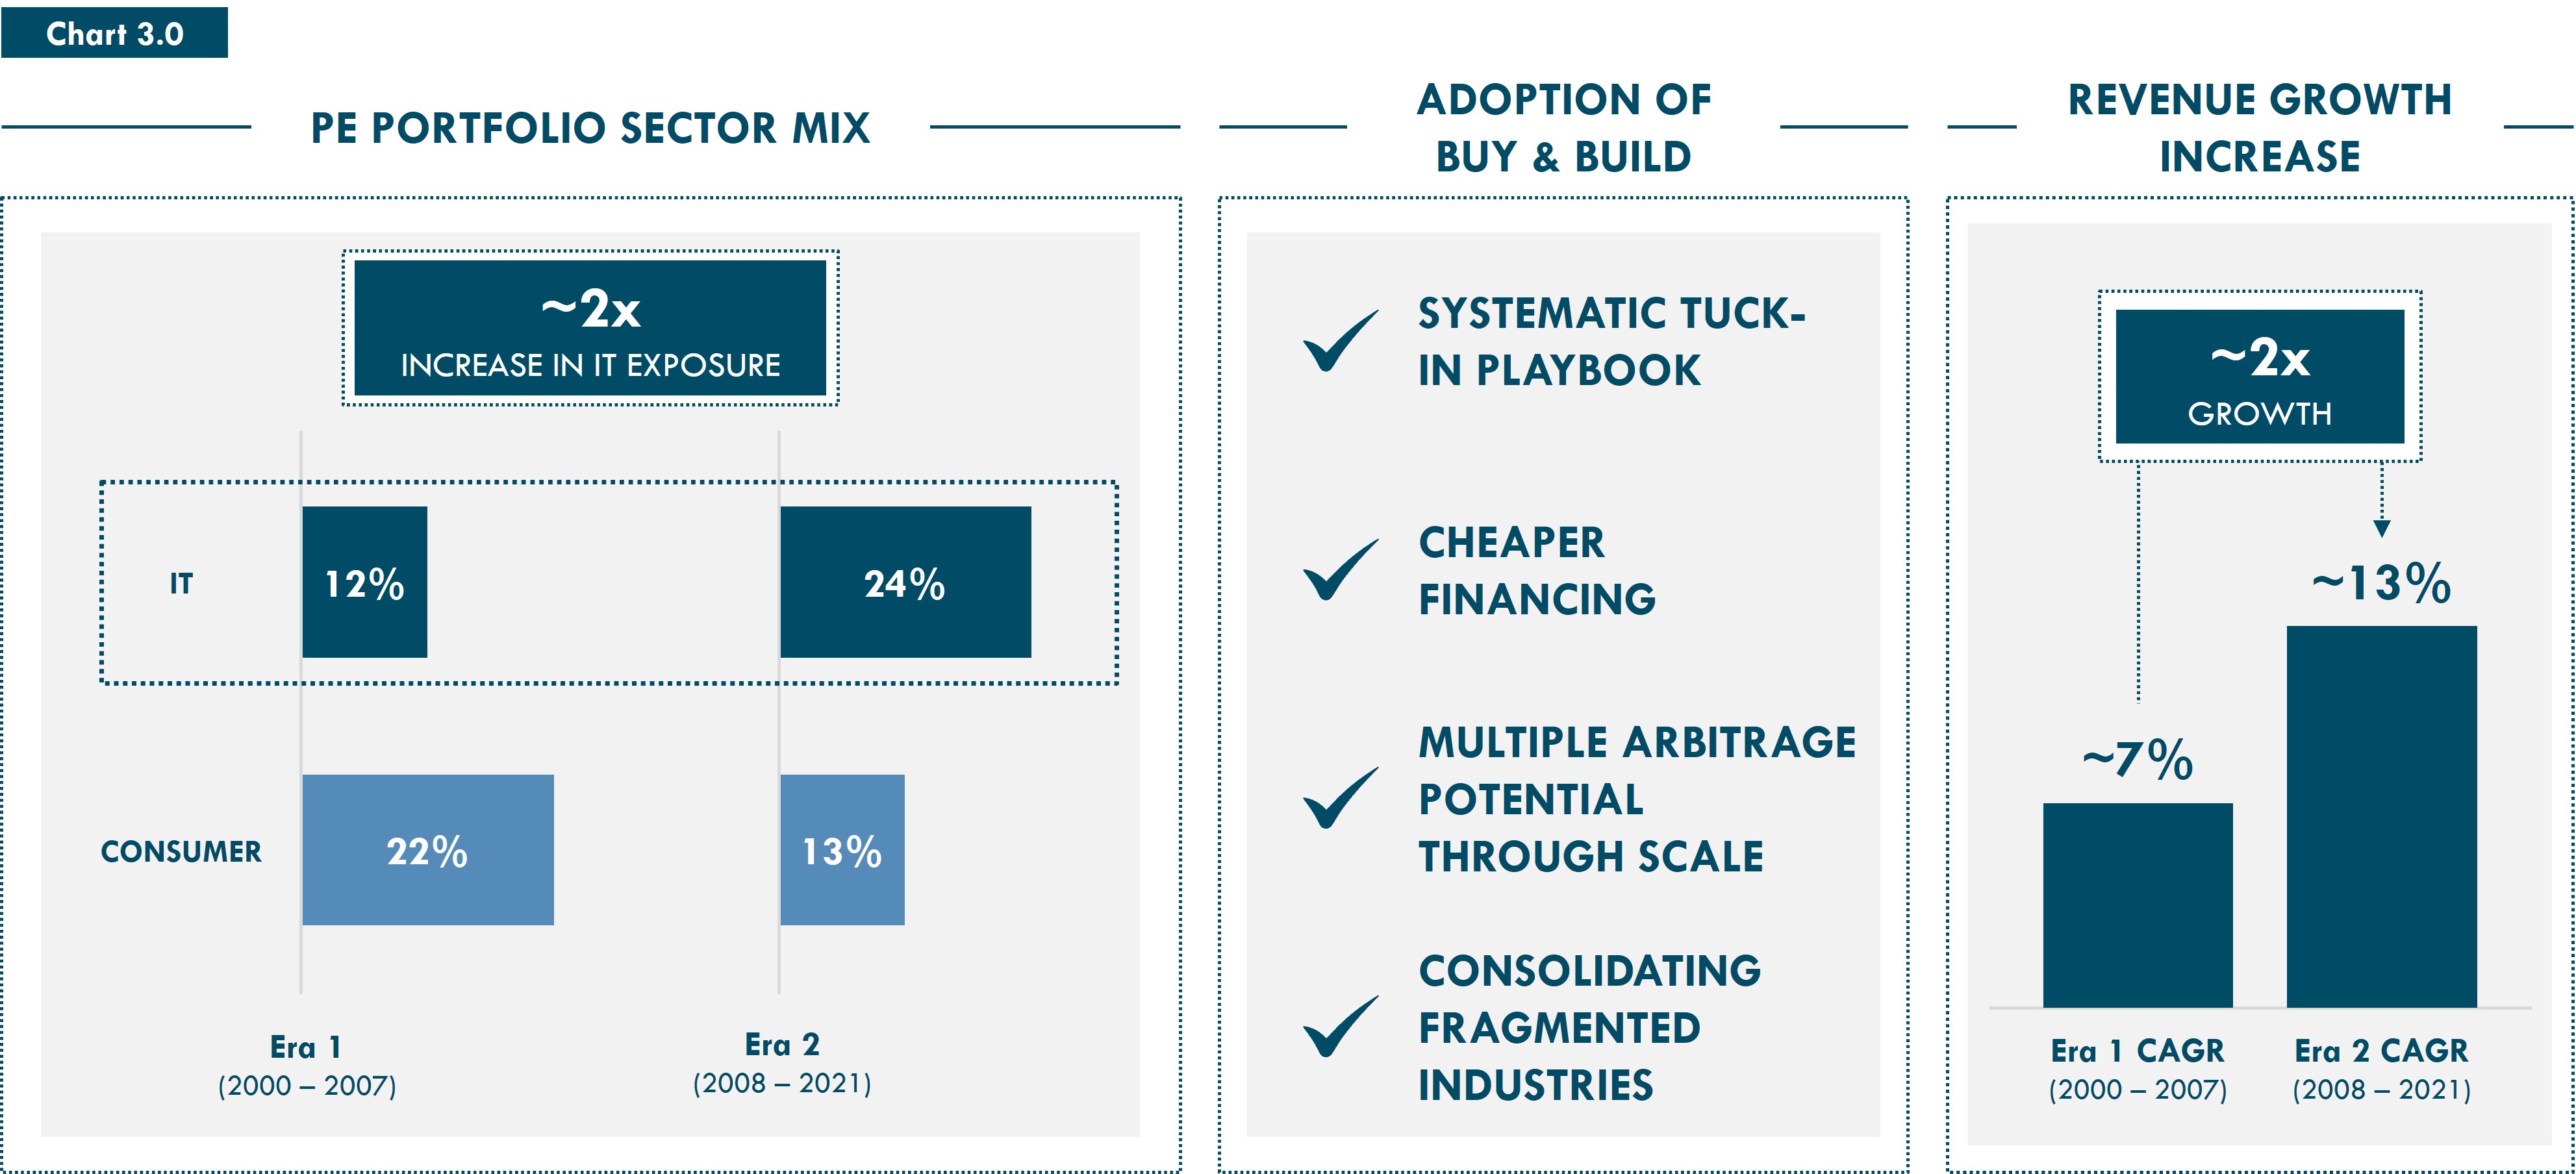
We believe two developments were particularly important in this time. First, was a sector tilt. Private equity portfolios migrated toward higher-growth sectors, including software and technology where the market was expanding faster, with IT exposure in private equity nearly doubling to 24% compared to the prior era, in stark contrast to the consumer sector nearly halving to 13% over the same period.
Second, sponsors refined and scaled the buy-and-build strategy into a systematic value creation model. Fragmented industries could be consolidated through targeted acquisitions, creating scale advantages, multiple arbitrage potential, and the foundation for accelerated growth. GPs professionalized sales organizations, added core capabilities, expanded globally, and used M&A as an operating strategy, not simply a transaction strategy (See Chart 3.0).
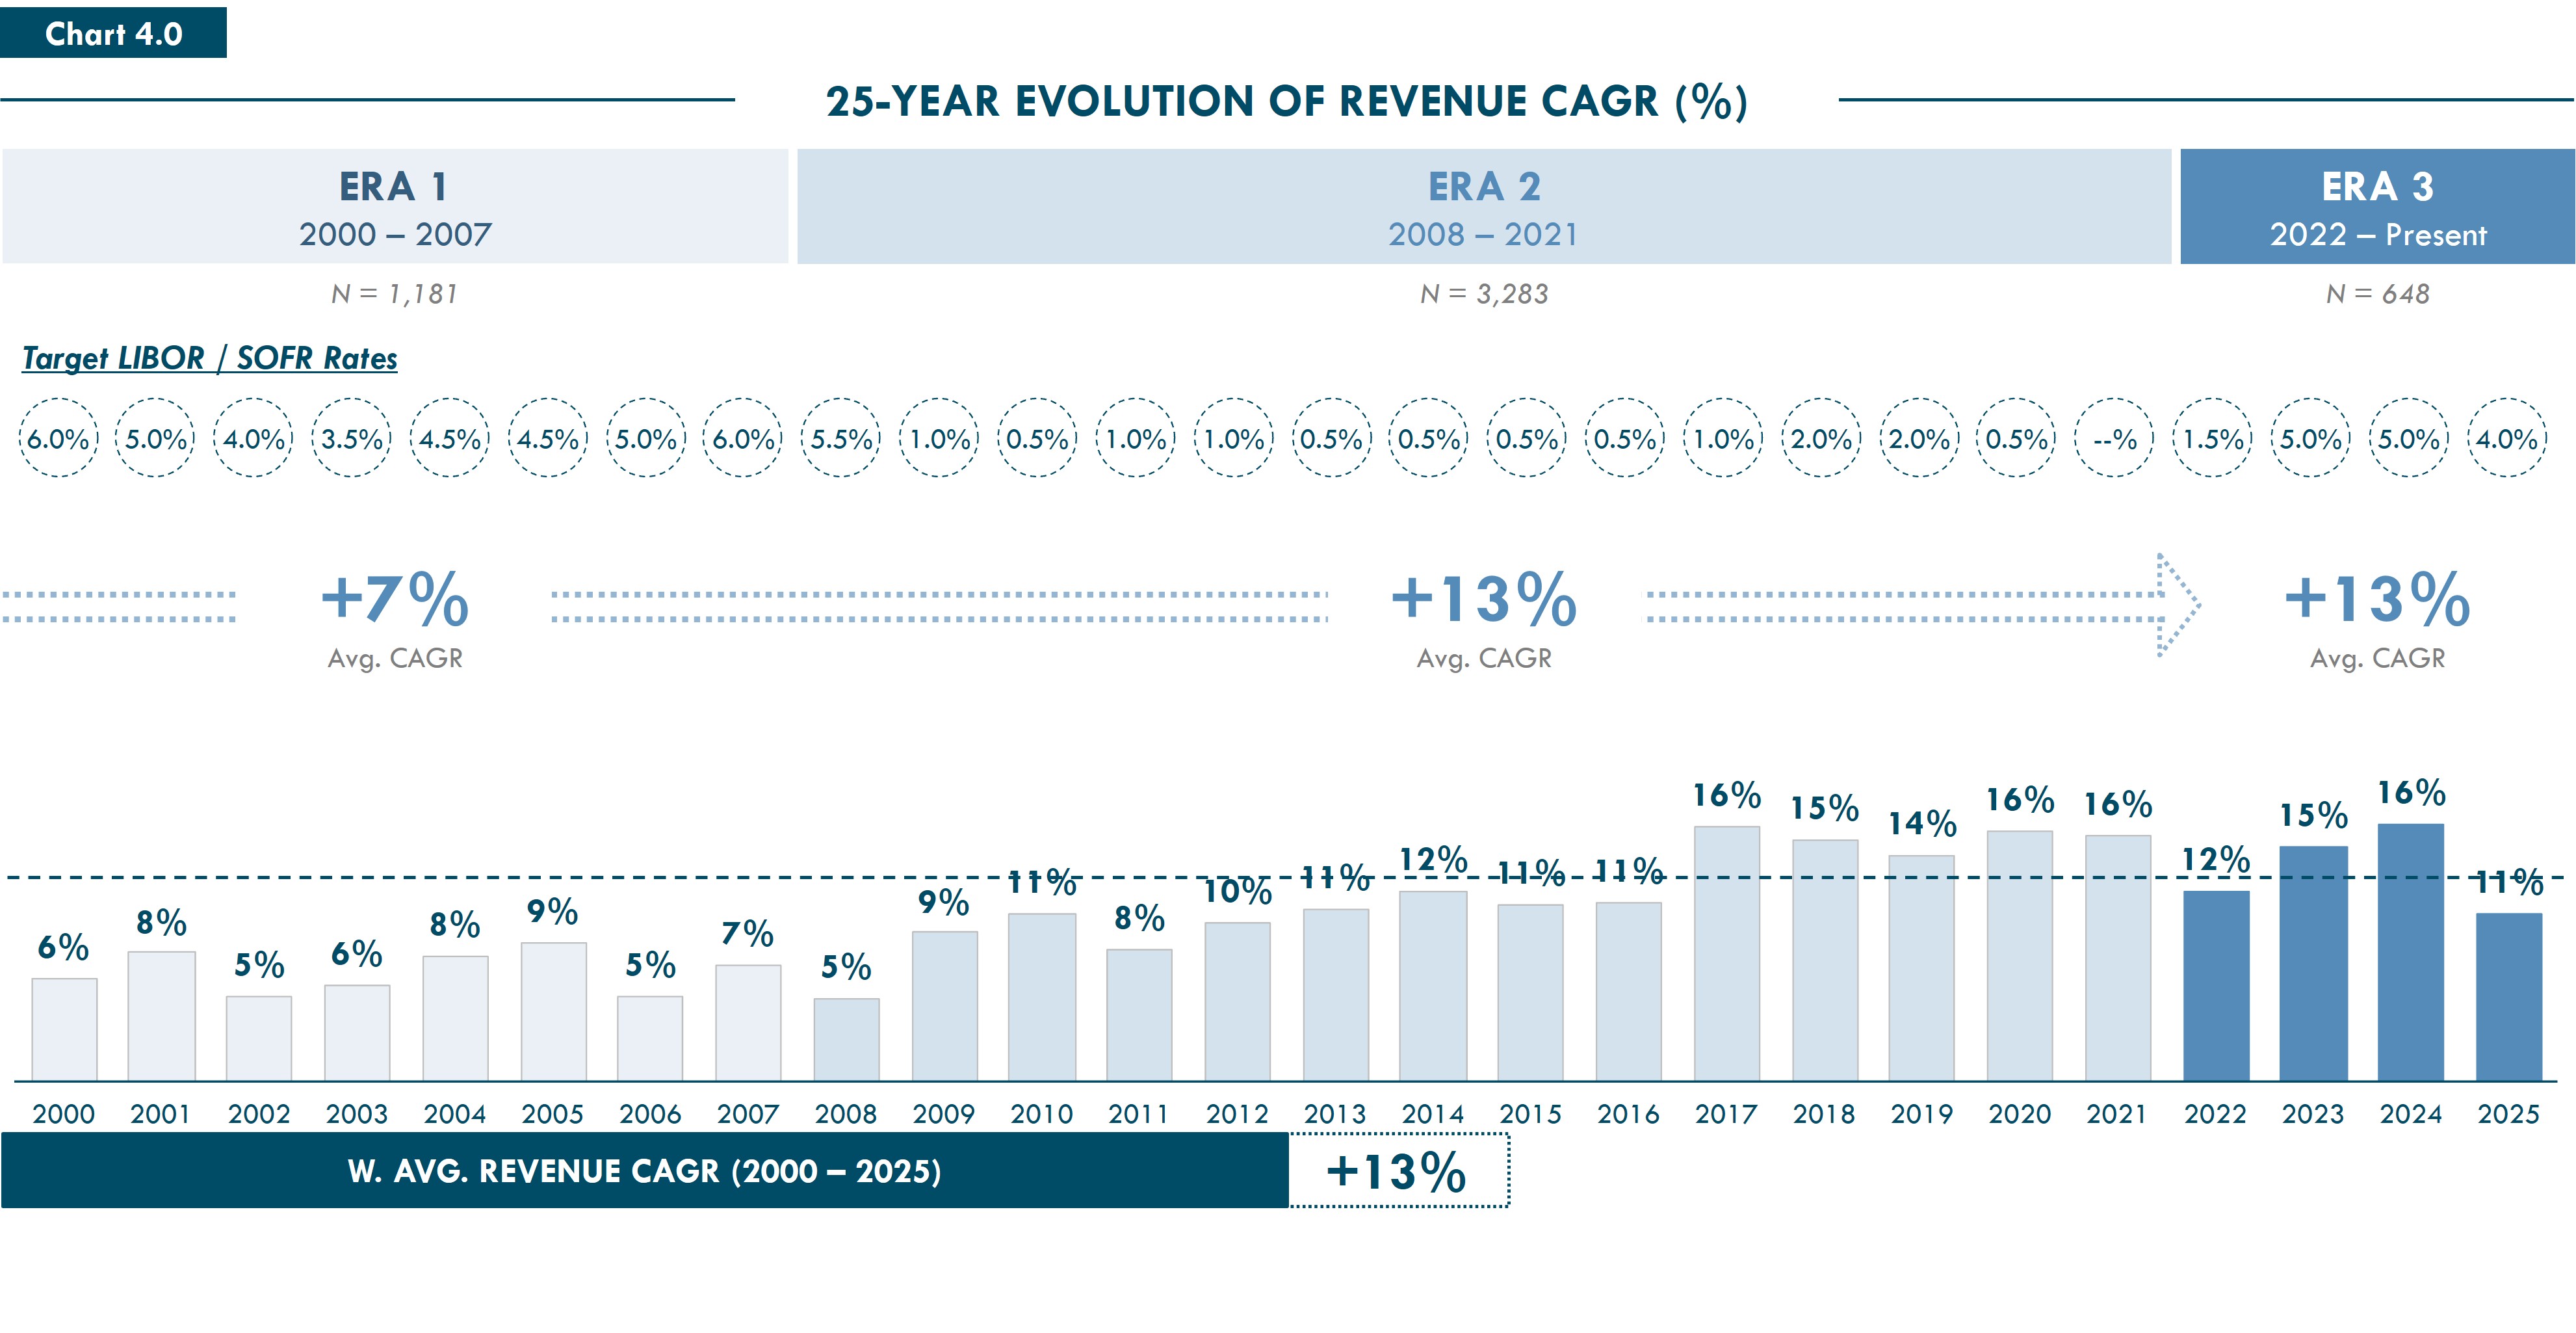
These factors helped propel revenue growth to nearly double that of the previous Era, from 7% to approximately 13% (See Chart 4.0). Operational value add was primarily derived through driving growth rather than operational efficiency.
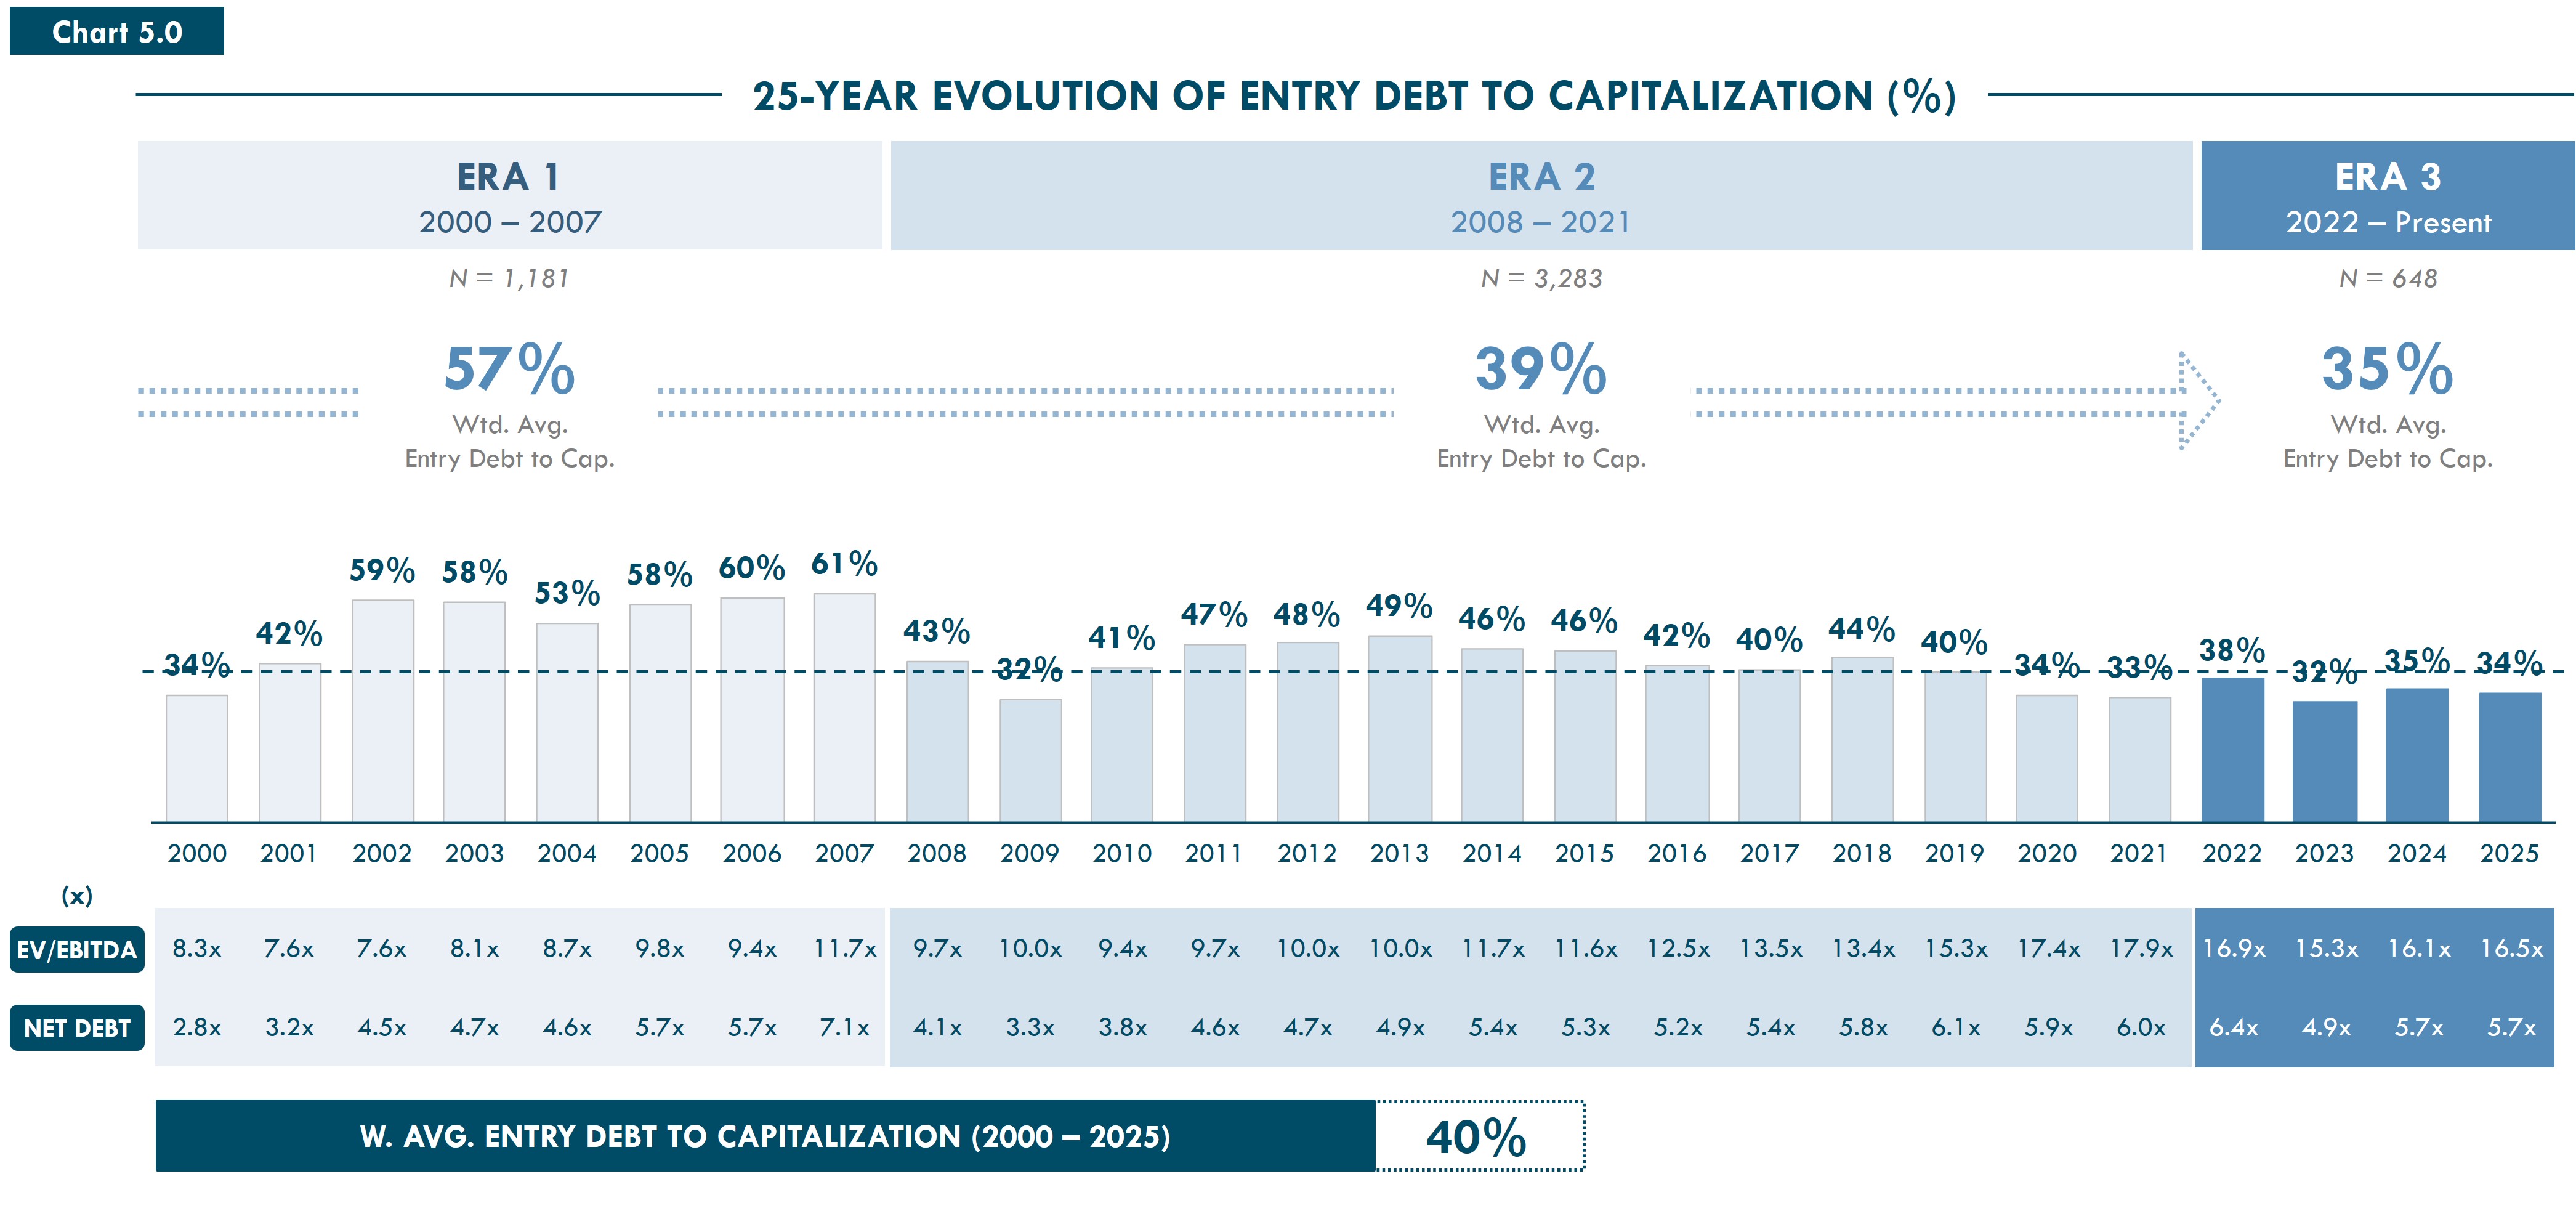
As such, despite a common industry narrative that Era 2 was defined by operational improvement and margin expansion, our data tells a different story. The bigger story, in fact, was growth. Businesses were now entering at higher valuations of 14x (up 4x from Era 1), reflecting a focus on faster-growing companies. However, while entry multiples expanded from 10x to 14x, leverage remained broadly unchanged at ~5x. This resulted in the average entry debt-to-cap decreasing from 57% in Era 1 to 39% in Era 2 (See Chart 5.0). Said differently, private equity was increasingly equitized, meaning equity needed to work harder to generate similar returns. It also means that private equity became less levered, and some may say less risky, given the evolved capital structure.
Focusing now on multiple expansion of 1.5x from entry to exit. Our analysis suggests that this expansion was beta driven as, over the course of Era 2, the Russell 3000 went through a period of equivalent multiple expansion of +1.5 turns. Lastly, and what we believe to be most interesting, was margin expansion, which by contrast remained relatively muted at +51 basis points (See Chart 6.0), suggesting that private equity was prioritizing growth over efficiency.
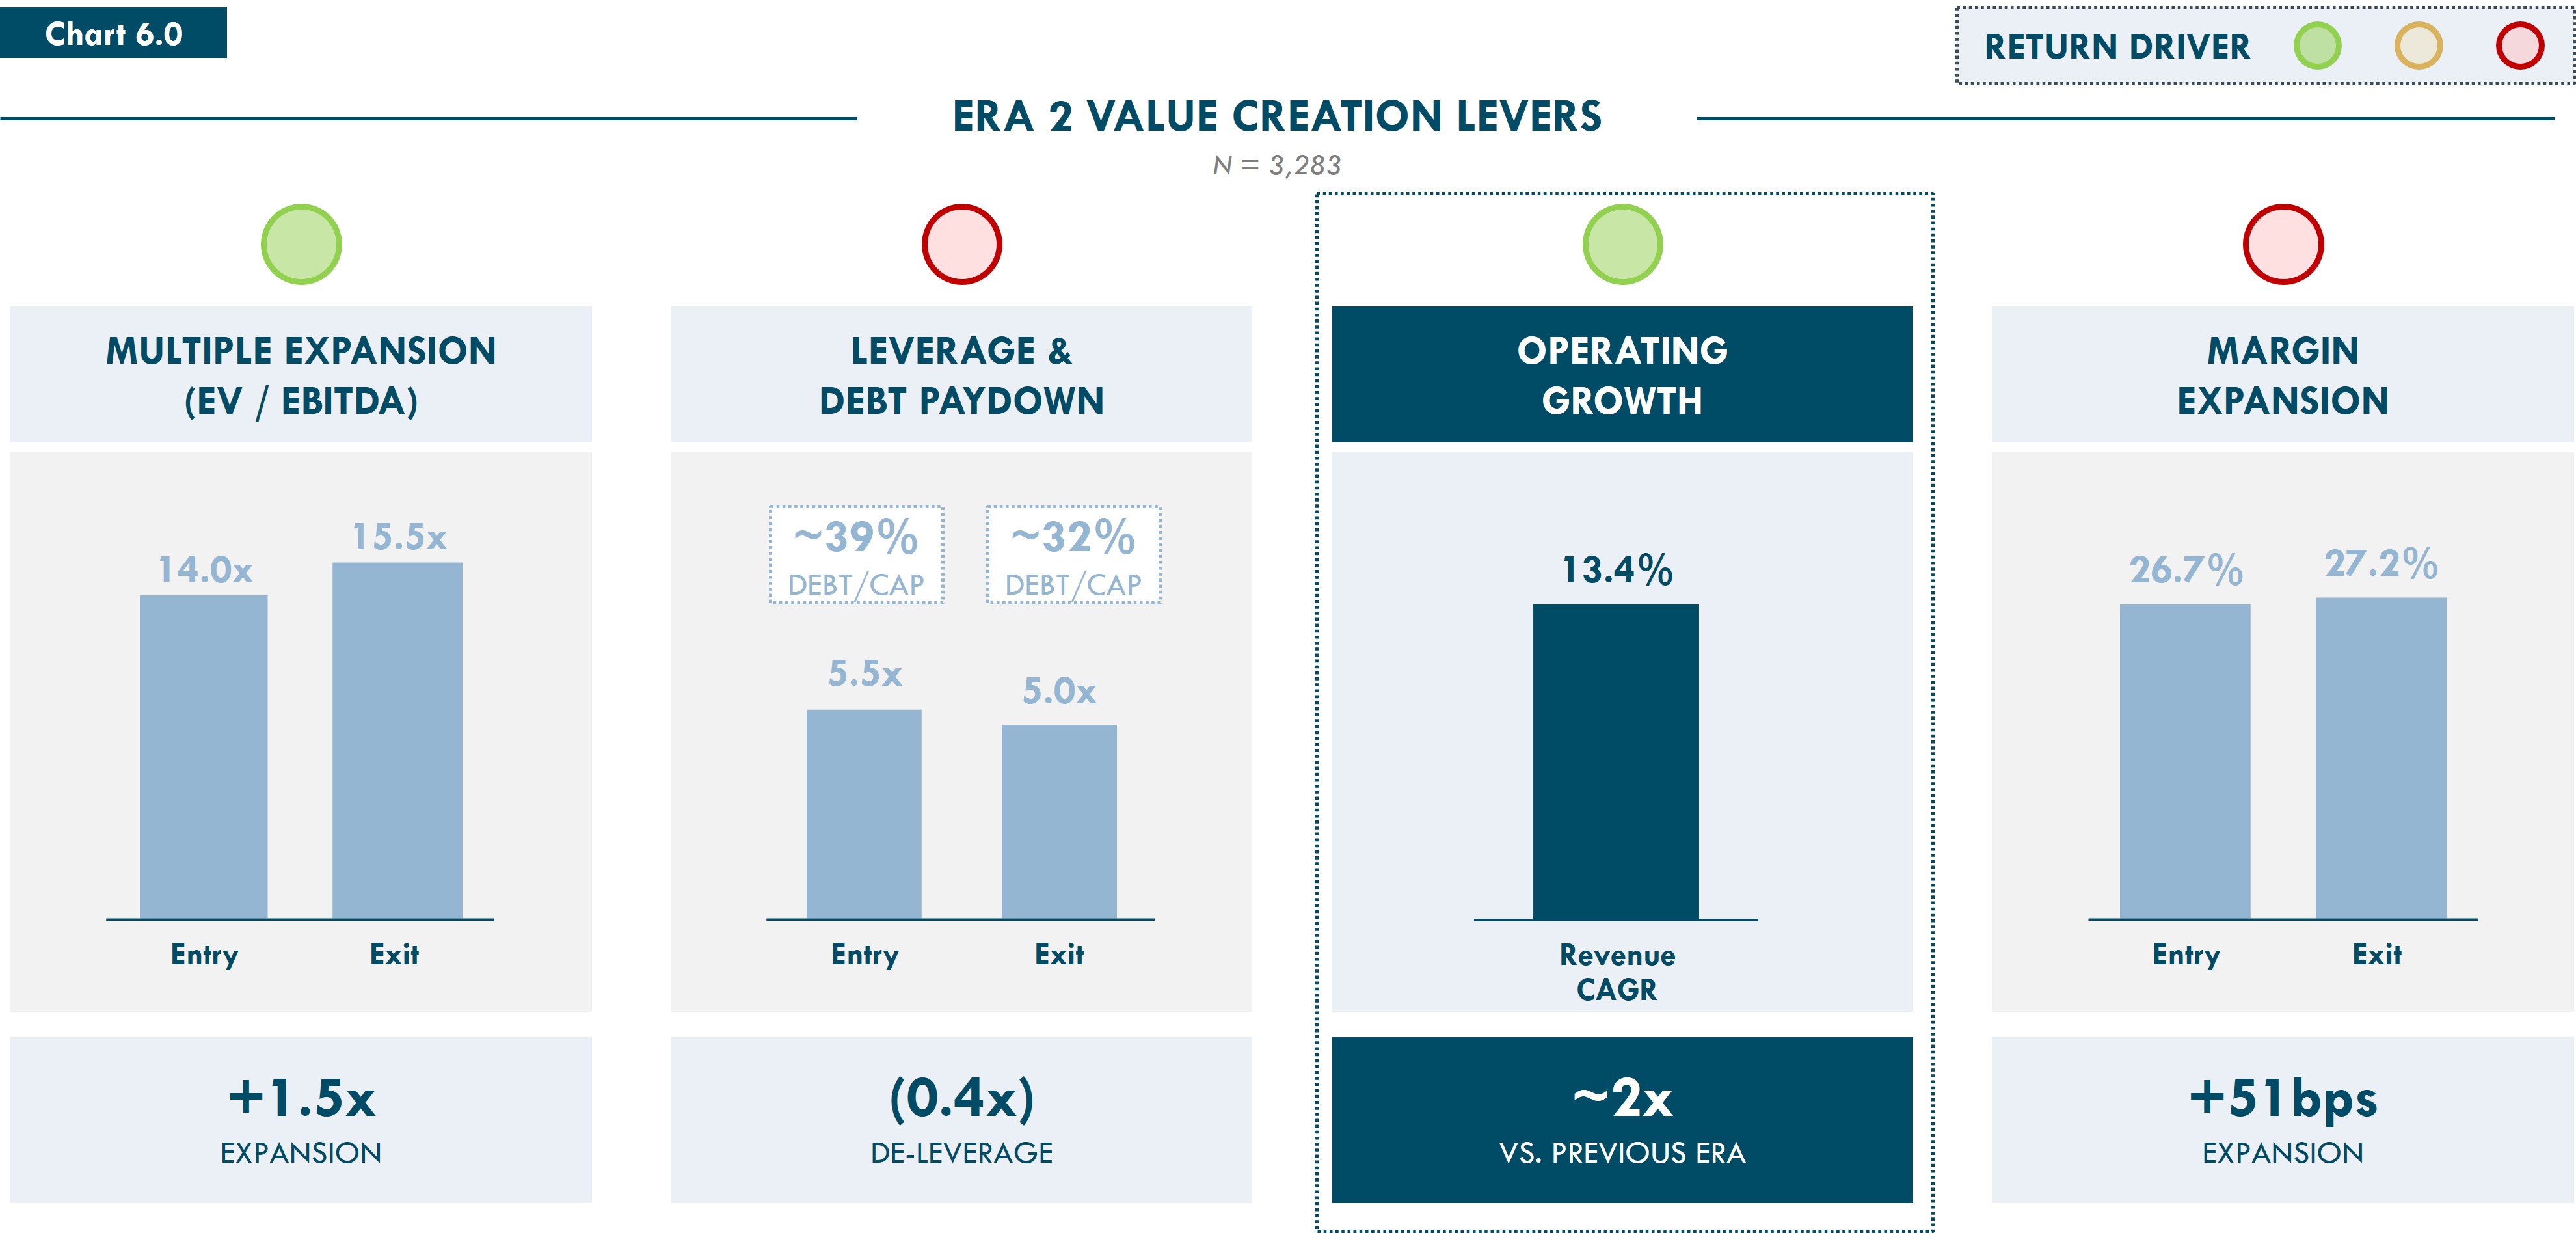
This era generated gross returns of approximately 2.20x MoC, with growth as the primary engine. The toolkit had expanded beyond leverage alone, and growth had become a defining source of alpha. This era, however, was also supported by powerful macro tailwinds: a favorable financing environment, globalization, digitization, and more capital. These conditions amplified every growth strategy. The question, as we look ahead, is whether those same tailwinds remain available? And, whether growth alone can continue to carry the asset class into its next era?
ERA 3: ACTIVE MANAGEMENT (2022-PRESENT)
We believe the evolving private equity toolkit was necessary to build sponsors’ capabilities and resilience. However, the existing playbook may no longer be sufficient on its own, and many of its traditional levers are becoming less differentiating. Valuation multiples have risen to approximately 16x at entry, 2 turns above the prior 25-year average. Assuming the next buyer will pay more is an insufficient strategy. The rate environment remains elevated and will likely take time to ladder down, meaning the low-cost debt that amplified performance through previous eras would no longer be available in the same form for some time. And while leverage has moderated from the peaks of Era 1, the question is whether debt markets will accommodate returning to debt-to-cap ratios closer to 50% or more. Without this, the capital structure will have limited room to contribute to returns the way it once did.
Against this backdrop, revenue growth remains elevated at ~13% CAGR. But sustaining rates above prior 25-year averages becomes increasingly difficult (See Chart 7.0). Buy-and-build strategies, once a source of differentiated alpha potential, have been widely adopted and may no longer be the edge they were. Sector tilts toward higher growth technology and software are well understood by the market, and as businesses scale, the compounding effect of early growth investments should naturally moderate.
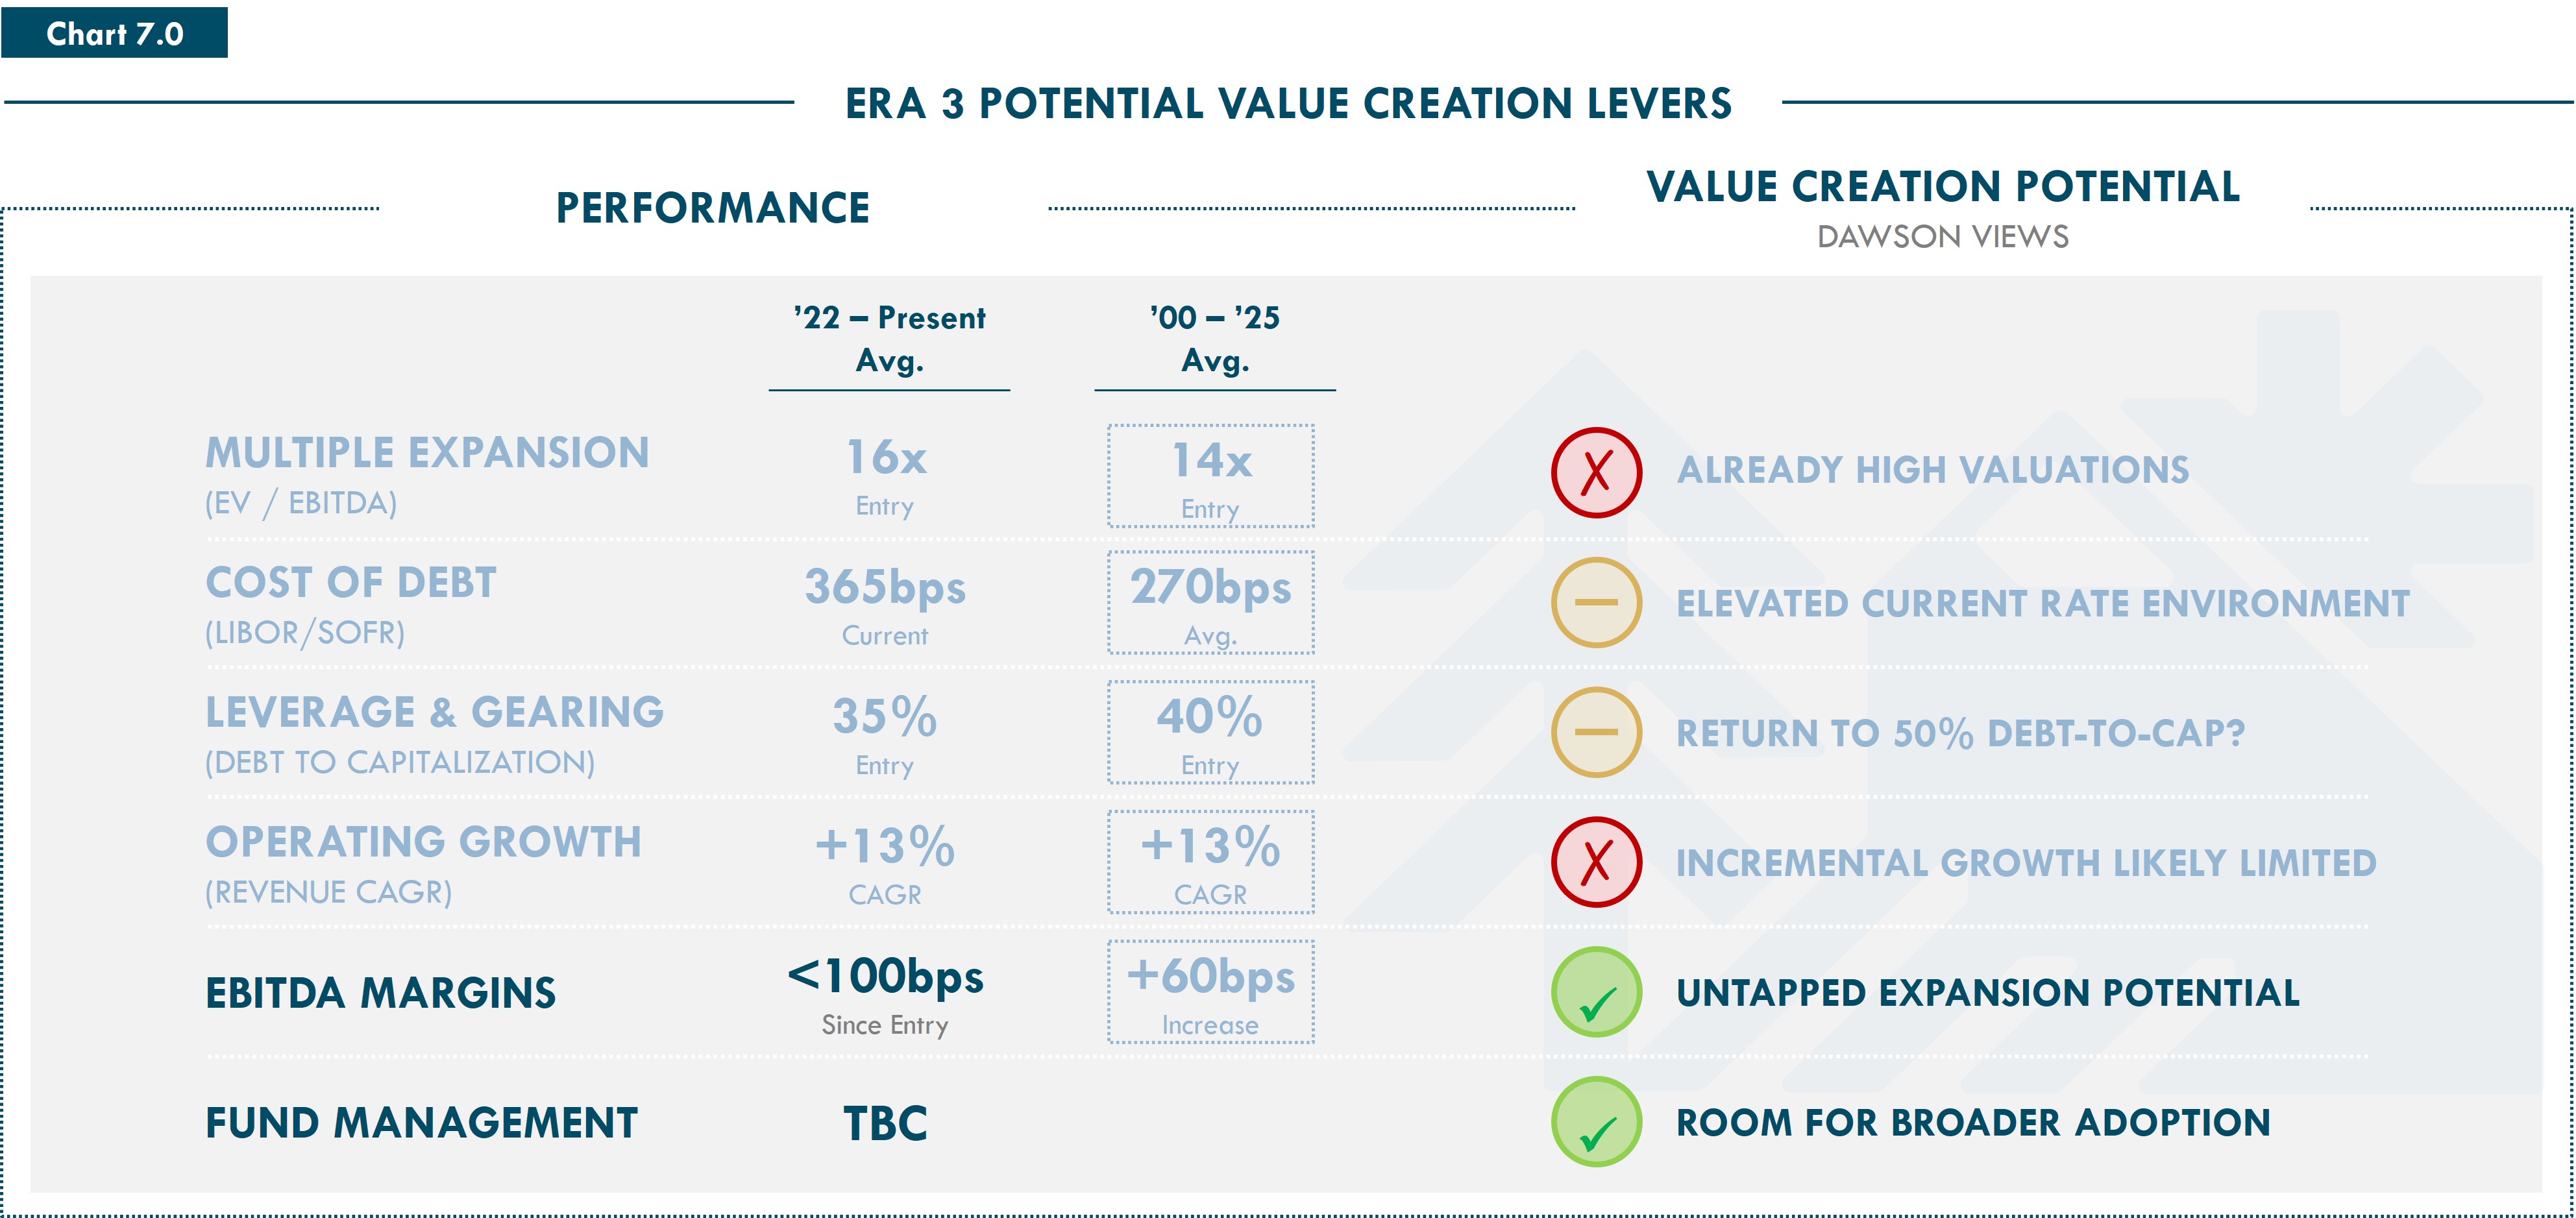
Said differently, the old levers have not disappeared. We believe private equity should still focus on maintaining EBITDA multiples, using leverage effectively, and driving double-digit growth. But reliance on those drivers alone may not be a sufficient path to historical returns.
We believe private equity needs its next era: the Era of Active Management. And that this is an opportunity for private equity to further drive operational efficiencies at scale in its assets. It should also focus on tools available to help narrow the gross-to-net spreads on performance. At its core, active management is not about a single technology or initiative. It is about systematically improving how businesses operate through better processes, stronger operating capabilities, more disciplined execution, and, increasingly, new technologies such as artificial intelligence.
So what needs to occur in this Era to drive additional value? We believe sponsors need to focus on margin expansion, which has averaged around ~50bps over the prior eras. Despite years of investment in operating partners, value creation teams and portfolio resources, realized margin expansion has remained modest relative to other drivers of returns, in our view creating an opportunistic moment. Operational value add needs to expand from not just the pursuit of growth, but also the pursuit of operational efficiency. But this will take focus, intentionality and execution to fully extract the productivity benefits available in this transformational opportunity. This efficiency has always been an objective of sponsors, and what is changing is not the desired outcome, but the breadth of tools available to pursue it.
Today, private equity may have access to an unprecedentedly transformational productivity tool. Artificial intelligence has the potential to fundamentally alter how businesses operate, generating significant productivity gains at both the enterprise and individual level, while also supporting revenue growth through enhanced sales intelligence, customer targeting, and product development.
Prior technological revolutions, Enterprise Resource Planning (ERP) systems, offshoring and globalization, and SaaS and cloud adoption each generated margin improvements typically ranging from 100 to 500 basis points. We believe AI implementation has the potential to produce a comparable or even greater impact. Early evidence from portfolio company deployments suggests AI could add 300 to 400 basis points to EBITDA margins over time, in line with the magnitude that offshoring delivered at its peak (See Chart 8.0).
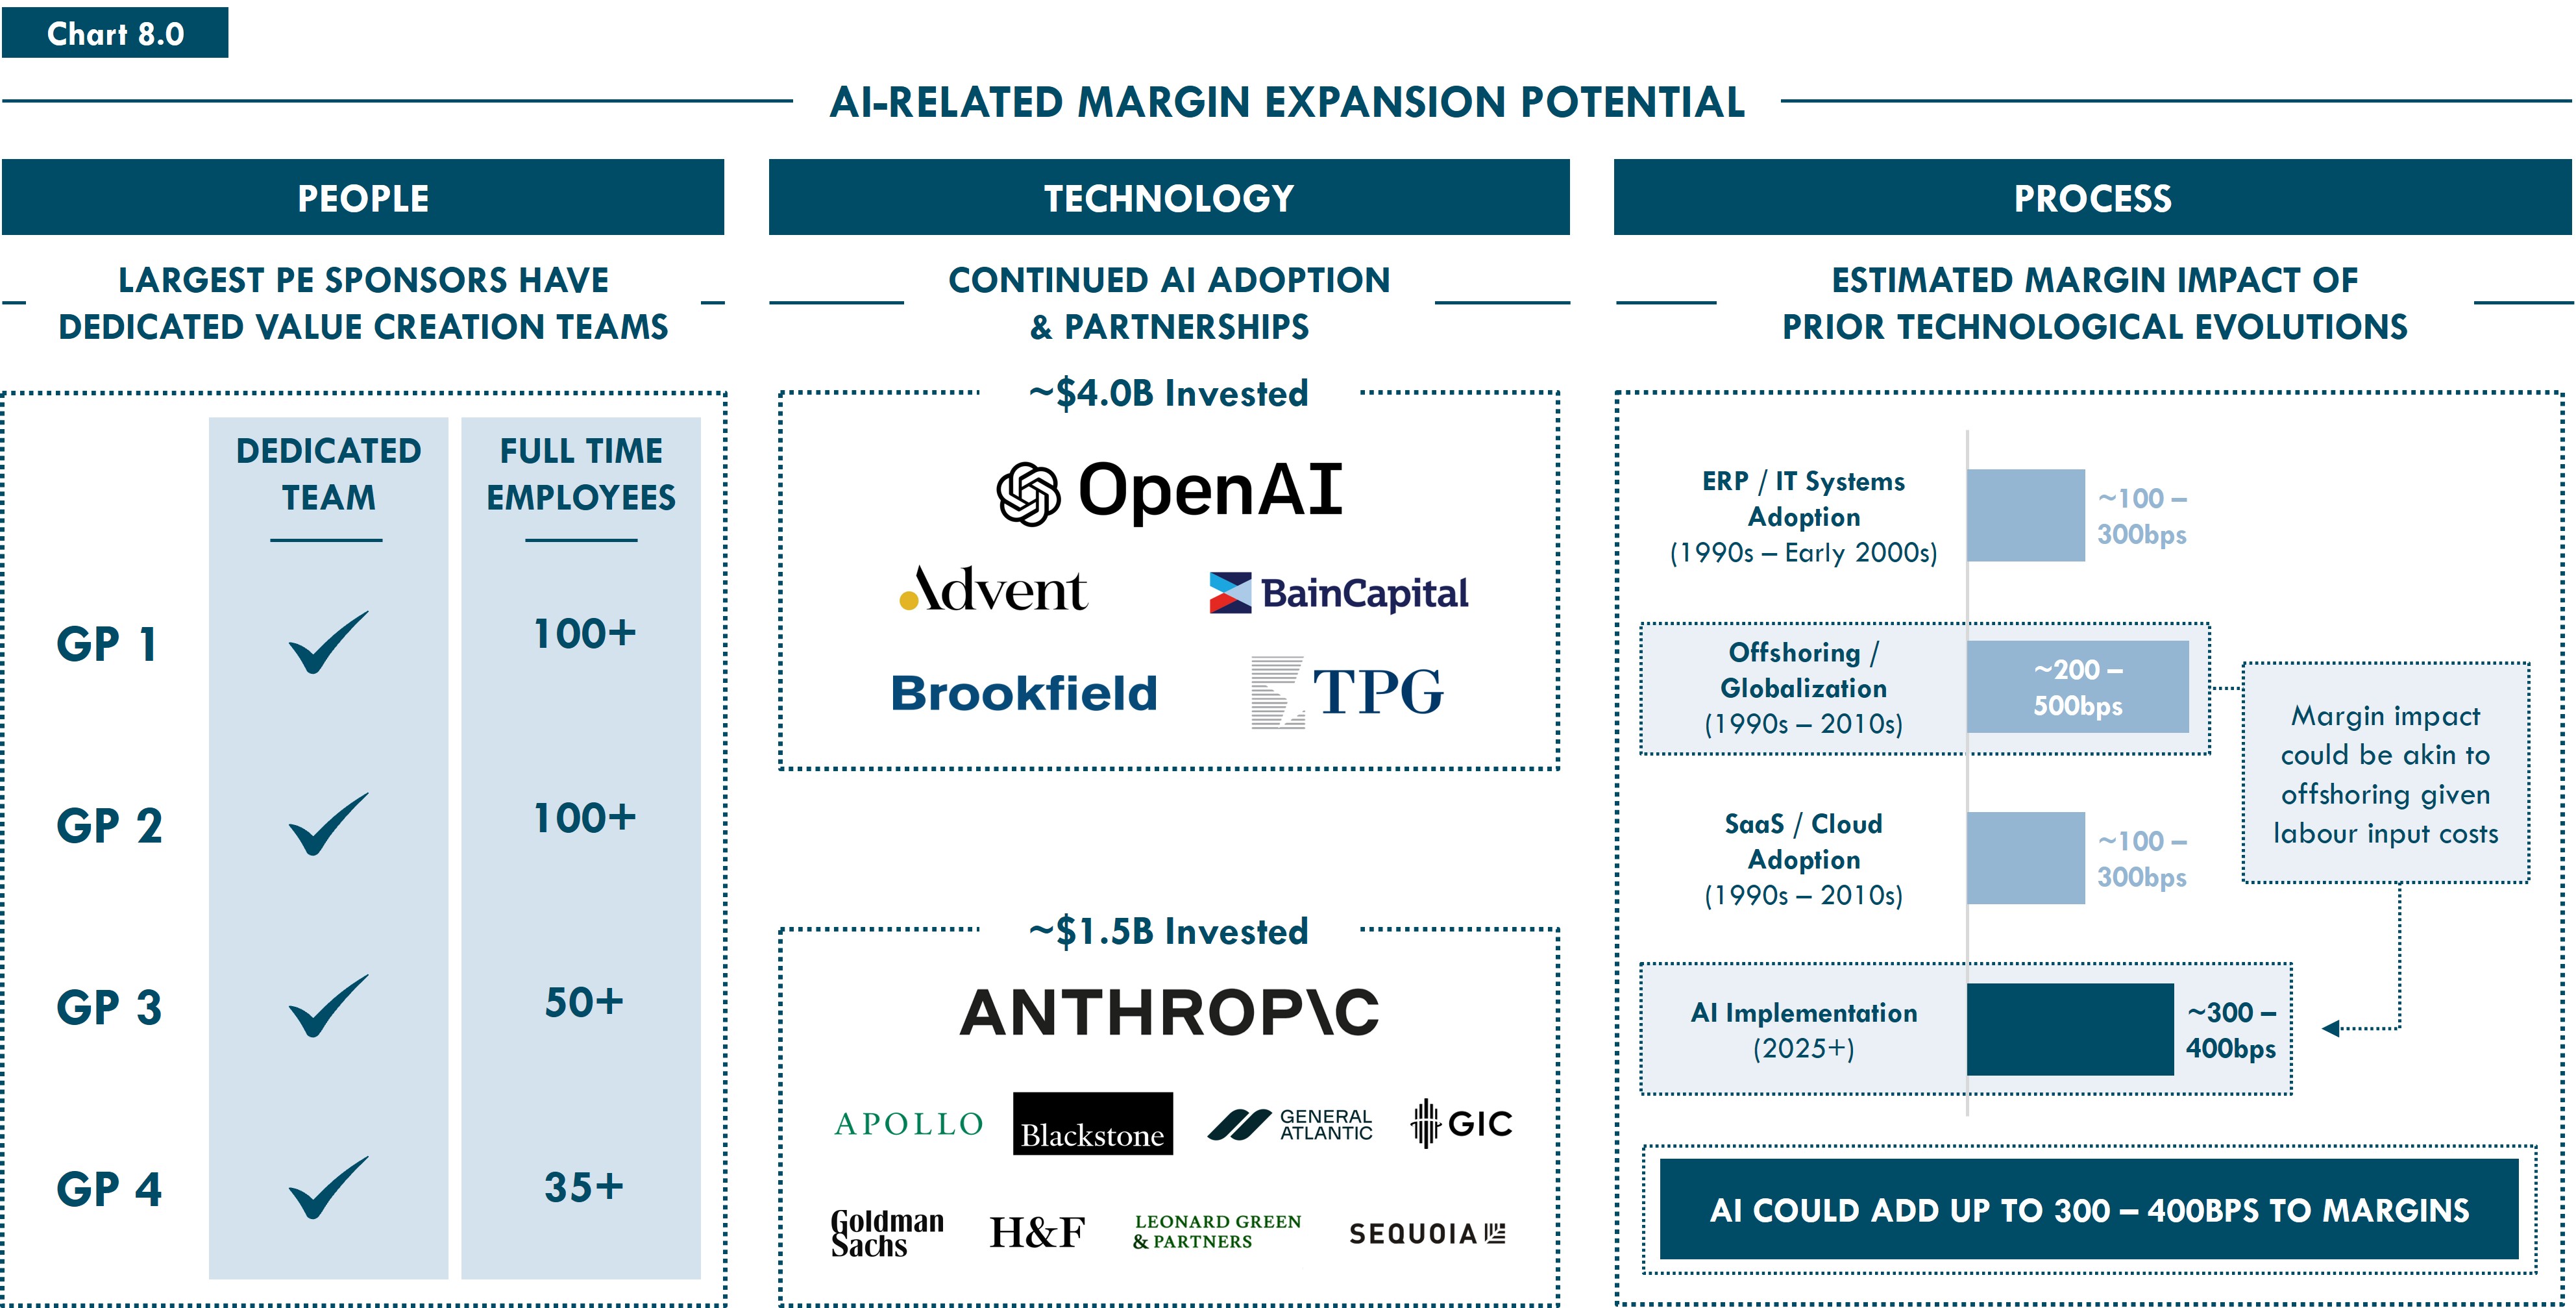
Critically, we see private equity as well-positioned to capture this potential opportunity. Unlike public markets, private equity possesses more concentrated ownership, direct governance rights, longer investment horizons, and the operational infrastructure to help drive implementation across portfolio companies. GPs can mandate AI adoption, provide dedicated resources, measure outcomes, and scale best practices across their portfolios. We believe the same ownership model that supported deleveraging in Era 1 and growth in Era 2 will become a competitive advantage in realizing AI-driven productivity gains in Era 3.
Importantly, we are not saying that growth disappears in this new era. Revenue growth of ~13% remains necessary to sustain historical returns, and AI will play a role in sustaining it through smarter go-to-market strategies, new product capabilities, and enhanced customer retention. The distinction is that in Era 3, margin expansion becomes a differentiating lever, one that can separate top performers from the rest.
Beyond asset-level levers, private equity sponsors will also need to explore how to translate outcomes to their LPs. How a fund itself is managed can represent an increasingly important and underutilized lever. Capital call facilities, recycling strategies, and disciplined portfolio construction can each compound net returns meaningfully, yet their adoption remains inconsistent across the industry. In an era where execution can be a differentiator, we believe active management is no longer a back-office consideration, but that it is instead a value creation tool in its own right.
WHAT DOES PRIVATE EQUITY NEED TO DO TO RETURN TO PRIOR 25-YEAR PERFORMANCE?
After understanding available levers, we asked ourselves: what would it take for private equity to return to historical levels of performance? To help understand this, we modeled several illustrative return scenarios that layer in the analyzed levers and tailwinds, with what we believe to be compelling results.
Starting with a scenario of headwinds, where valuation multiples contract by 2x from entry to exit, so long as other levers remain consistent, the analysis suggests an approximately 8.0% net IRR. By private equity standards, this is a meaningful decline from the prior 25-year average (13%), but it is broadly in line with public market returns over the same 25-year period (9% per Russell 3000).
In an environment where value creation levers perform generally in line with prior 25-year averages, where revenue growth, valuation multiples, operating margins, and leverage provide limited additional support, private equity generates approximately 10.5% net IRR. This is a defensible outcome, but it falls below the asset class's prior 25-year historical average of ~13%.
Stepping into more active management, and introducing 365 basis points of margin expansion, within range of potential AI-enabled operational productivity gains discussed above, increases illustrative net returns to approximately 13.4% IRR. This would be the amount of margin expansion necessary to return the asset class to its prior 25-year average, all else being equal.
Lower financing costs provide further upside potential. In a scenario where the cost of debt improves, illustratively, with a SOFR rate of 150 basis points, returns improve further to approximately 14.2% net IRR.
Beyond asset-level levers, active management of a fund can compound these outcomes and drive results for LPs. The illustrative use of increasing capital call facilities from 6 to 12 months can add a further layer of net return enhancement, bringing returns to approximately 15.6% net IRR in a well-managed scenario (See Chart 9.0).
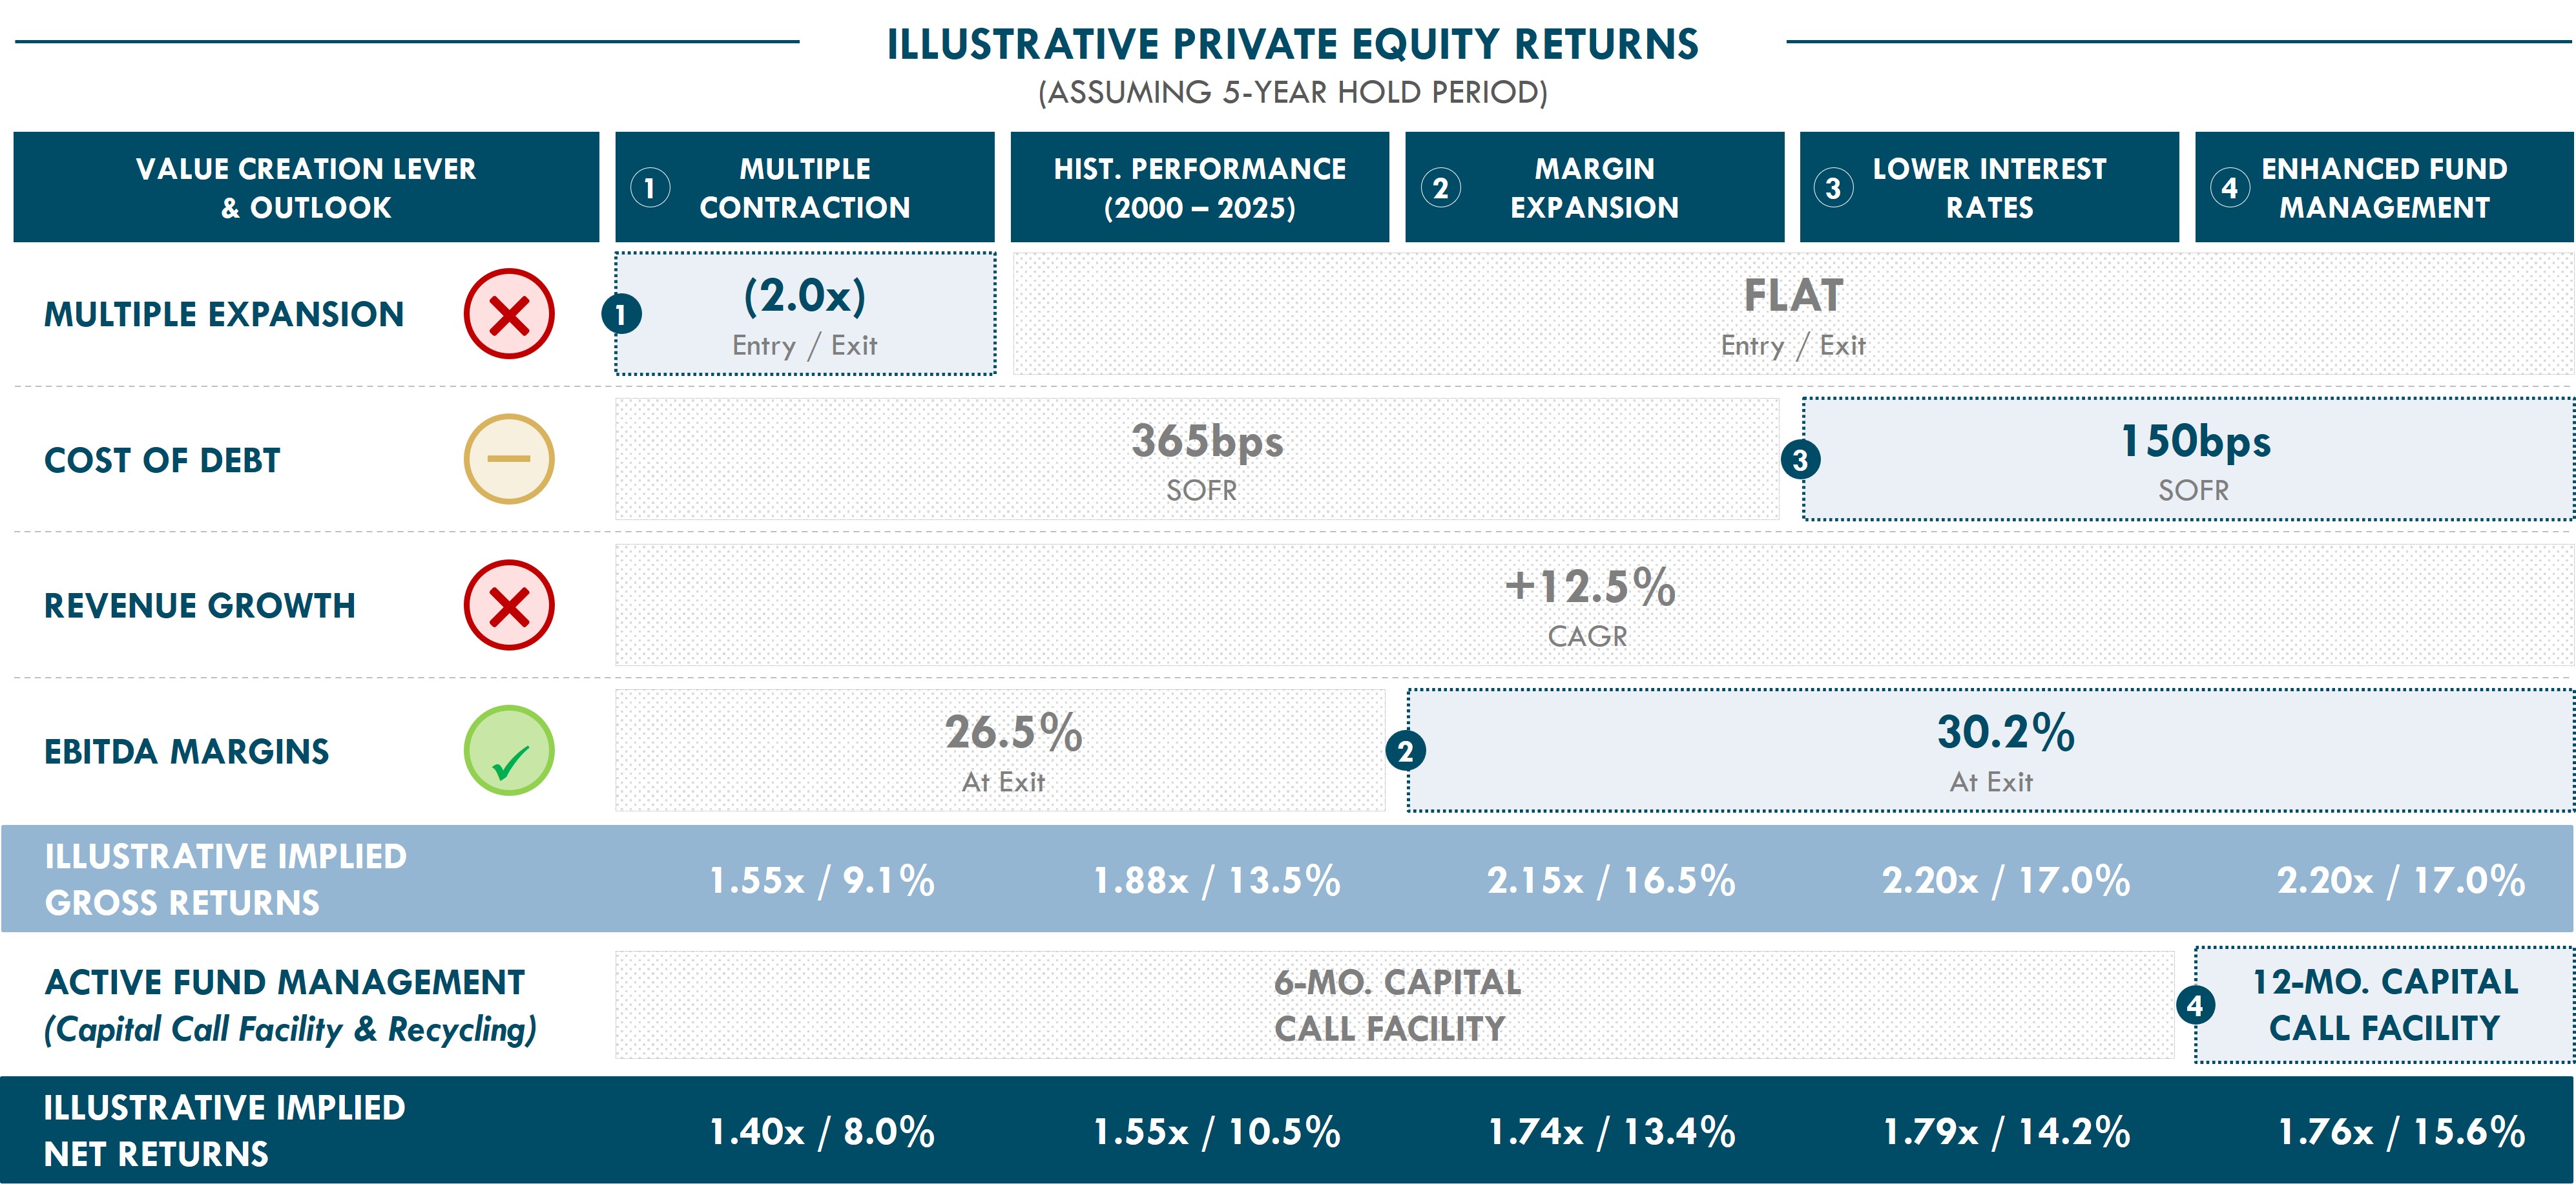
What is striking about these scenarios is what they do not require. They do not rely on multiple expansion, elevated leverage, or revenue growth beyond prior 25-year averages. They do not assume a return to the macro tailwinds of Era 2. Instead, they illustrate how private equity can approach, and exceed, historical return levels using levers that at least in part can be influenced by sponsors. While illustrative, we believe this paints a potentially compelling picture of the return potential of private equity in different environments.
CONCLUSION
Private equity's future will not look identical to its past. But its potential remains intact.
Over the past 25 years, private equity was evolving its toolkit. Era 1 delivered the discipline of capital structure. Era 2 delivered the machinery of growth. We believe Era 3 is the moment when sponsors need to deliver operational efficiencies at scale to drive differentiated returns.
The Era of Active Management is not meant to be a retreat from what has made private equity successful. It is an evolution of it. The ownership model, governance structure, and patient capital are expected to be advantages in an environment that rewards execution. They become more powerful and drive efficiencies at scale.
From our perspective, What Got PE Here, Won’t Get It There. However, the potential opportunity ahead is grounded in latent value: margin expansion that has been consistently underutilized, AI-driven productivity tools that are only beginning to be deployed at scale, and a generation of GPs who have spent years building the operational capabilities to realize them. The next cycle, we believe, will reward the sponsors willing to put those capabilities to work.
The private equity toolkit has always evolved, and so must the thinking around it. This paper is the first in a three-part series: Dawson’s Spotlight on Private Equity. In this paper, we examined historical drivers of private equity's performance to understand what the asset class may need to carry it forward. In the papers that follow, we will explore how private equity's performance has fared relative to public markets and its evolving role in institutional portfolios. Our last of the series will focus on the specific adaptations that GPs and LPs may need to make to succeed in the Era of Active Management.
Legal Disclaimer: Based upon Dawson's current views informed by historical data, published sources, other third parties and Dawson's proprietary database and analysis. Past performance is not indicative of future results. No assurances can be made that historical trends will continue or that expectations will materialize. Actual results may differ materially and should not be interpreted as guarantees of future performance. Chart 1.0: Source: MSCI Private Capital Solutions data as of December 31, 2025 and reflects the pooled investment performance of certain North American and European buyout funds selected by MSCI across all vintages, industries and fund sizes. Charts 2.0, 3.0, 4.0, 5.0, 6.0, 7.0 & 9.0: Source: Except where otherwise indicated, Dawson proprietary data based on all assets of all primarily buyout-focused GPs for which Dawson has access to sufficient data. Russell 3000 data, as of December 31, 2025, and is inclusive of dividend reinvestment and withholding tax deduction on dividends. References to LIBOR/SOFR: LIBOR was replaced with SOFR as the reference rate following the Financial Conduct Authority's 2017 announcement that it would no longer compel panel banks to submit LIBOR rates, prompting a broad transition across financial markets to SOFR as the preferred risk-free benchmark. Chart 9.0: Illustrative returns are calculated using a Dawson LBO model that includes the assumptions outlined and assumes a five-year hold period. Capital call facilities in illustrative scenarios are at a cost of SOFR + 1.90%, consistent with indicative pricing from lender discussions. Net fees assume fund economics consisting of 20% carried interest and a 1.40% blended management fee, aligned with historical fund economics across the GPs in Dawson's data set. Illustrative return scenarios are presented for informational purposes only and should not be interpreted as forecasts or expected investment outcomes. For purposes of “Hist. Performance (2000-2025)”, EBITDA